City and province profiles for brands entering China — population, GDP, digital platform penetration, key industries and practical market entry insights.
Compare population, spending power and GDP growth across 53 cities to prioritise your China market entry — instead of defaulting to Shanghai or Beijing.
WeChat, Douyin and Xiaohongshu penetration estimates per city help you choose where to seed content, run KOL campaigns and open stores.
GDP, growth and population from National Bureau of Statistics and provincial bulletins (2025), refreshed as new yearbooks are released.
53 major cities — click a marker for its full profile
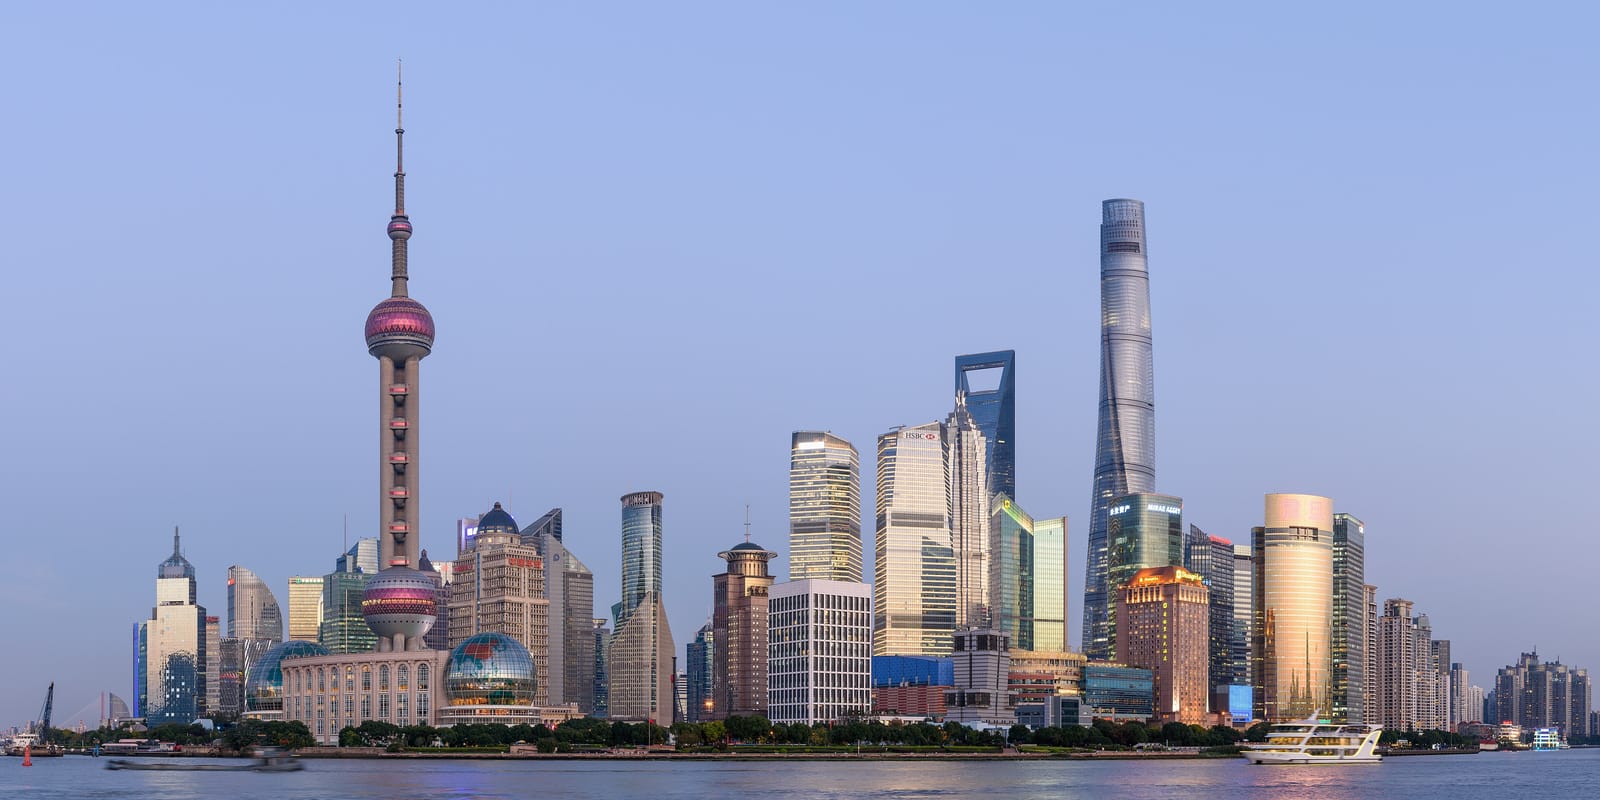 Tier 1
 · East · Shanghai
 Tier 1
 · North · Beijing
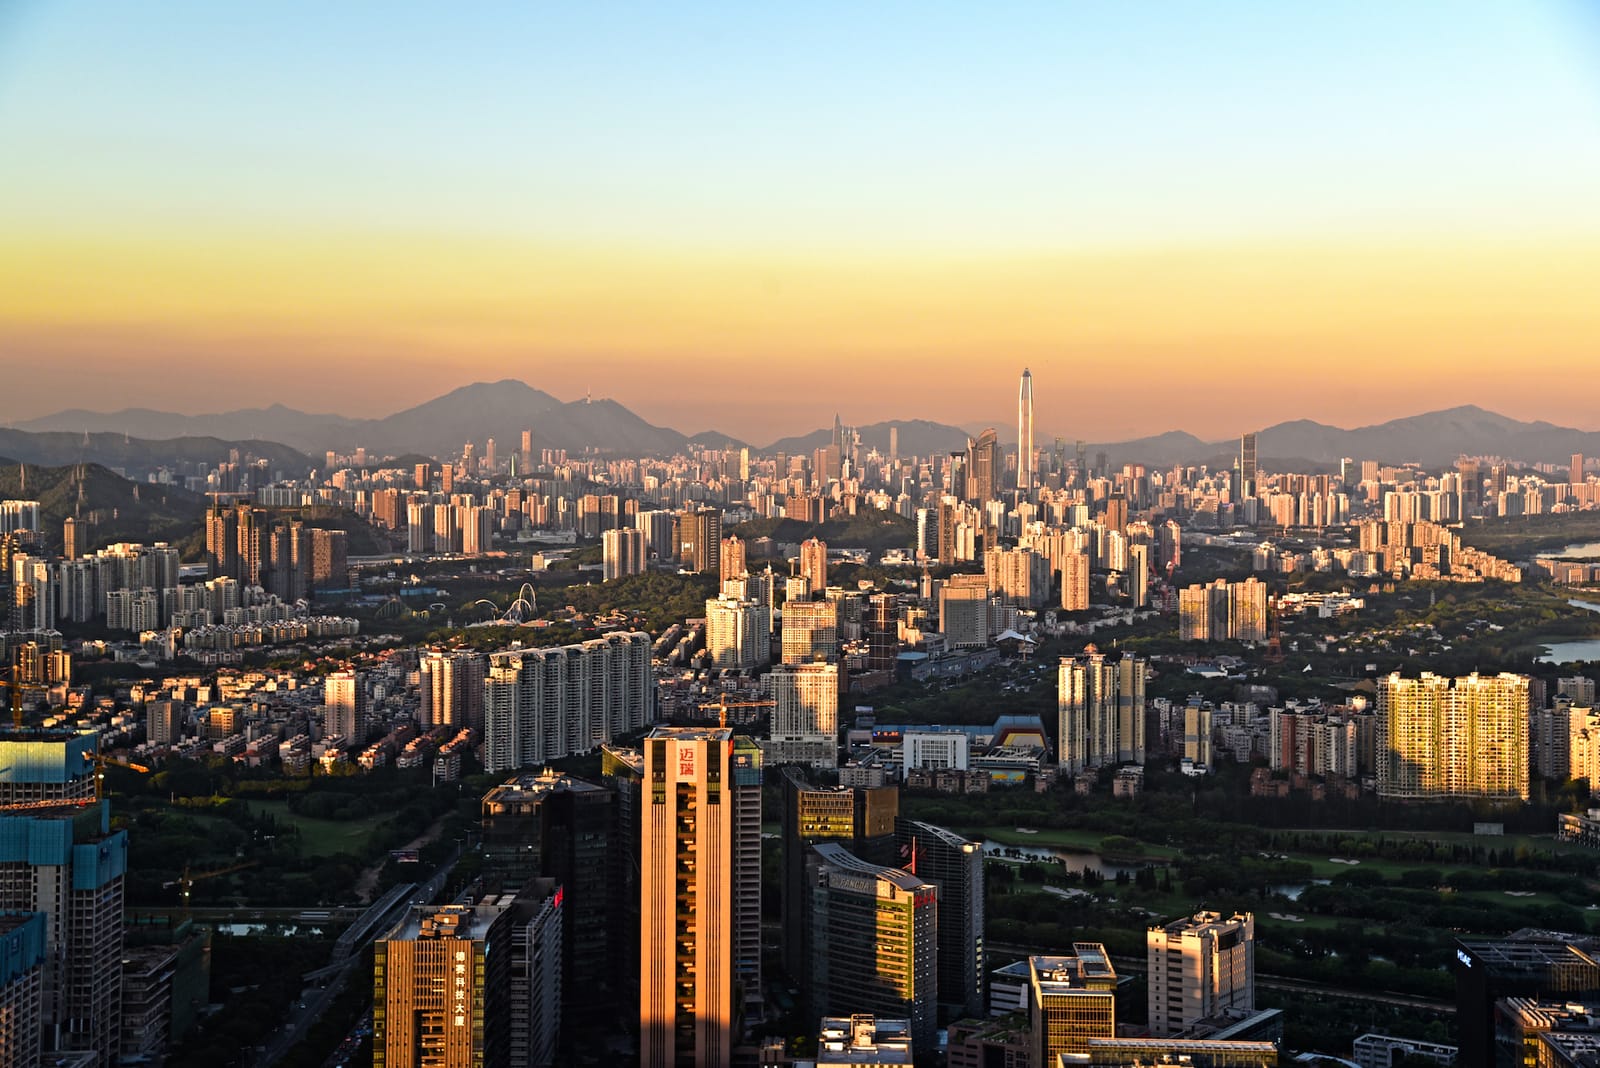 Tier 1
 · South · Shenzhen
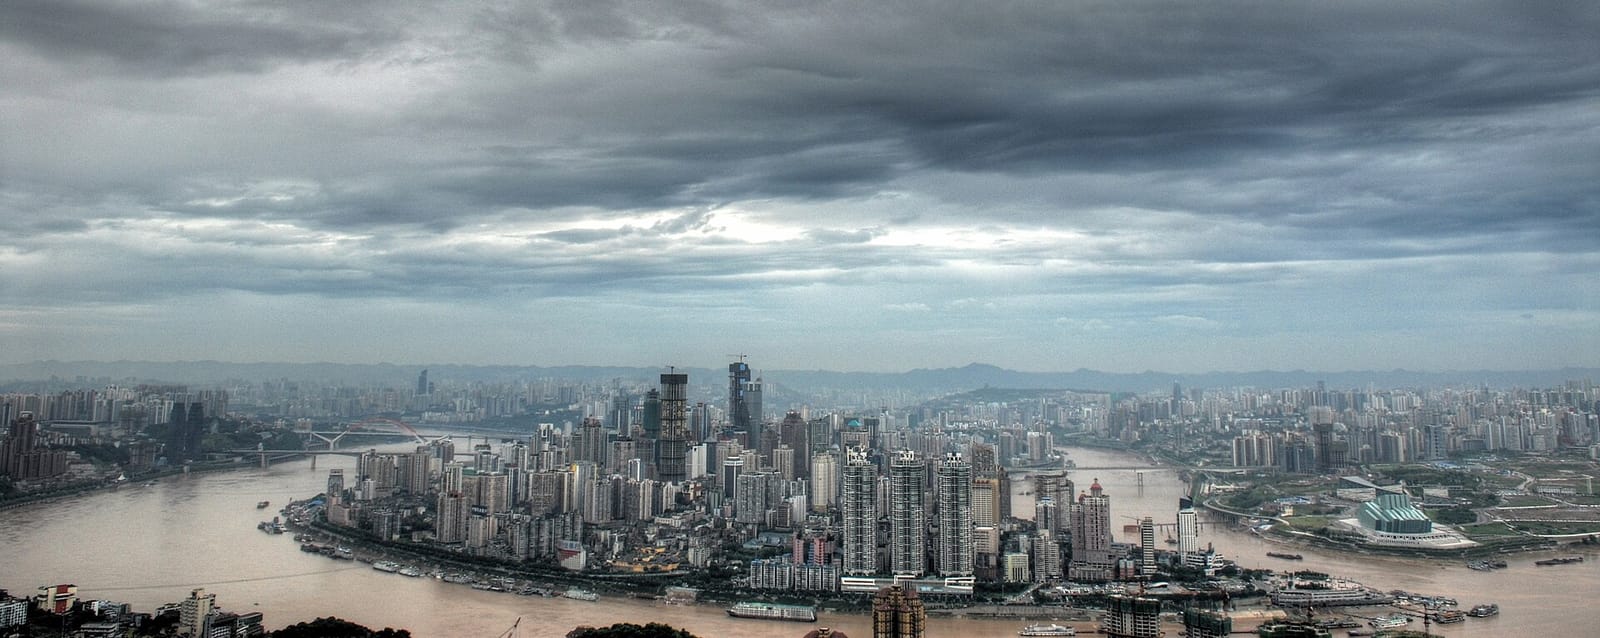 New Tier 1
 · Southwest · Chongqing
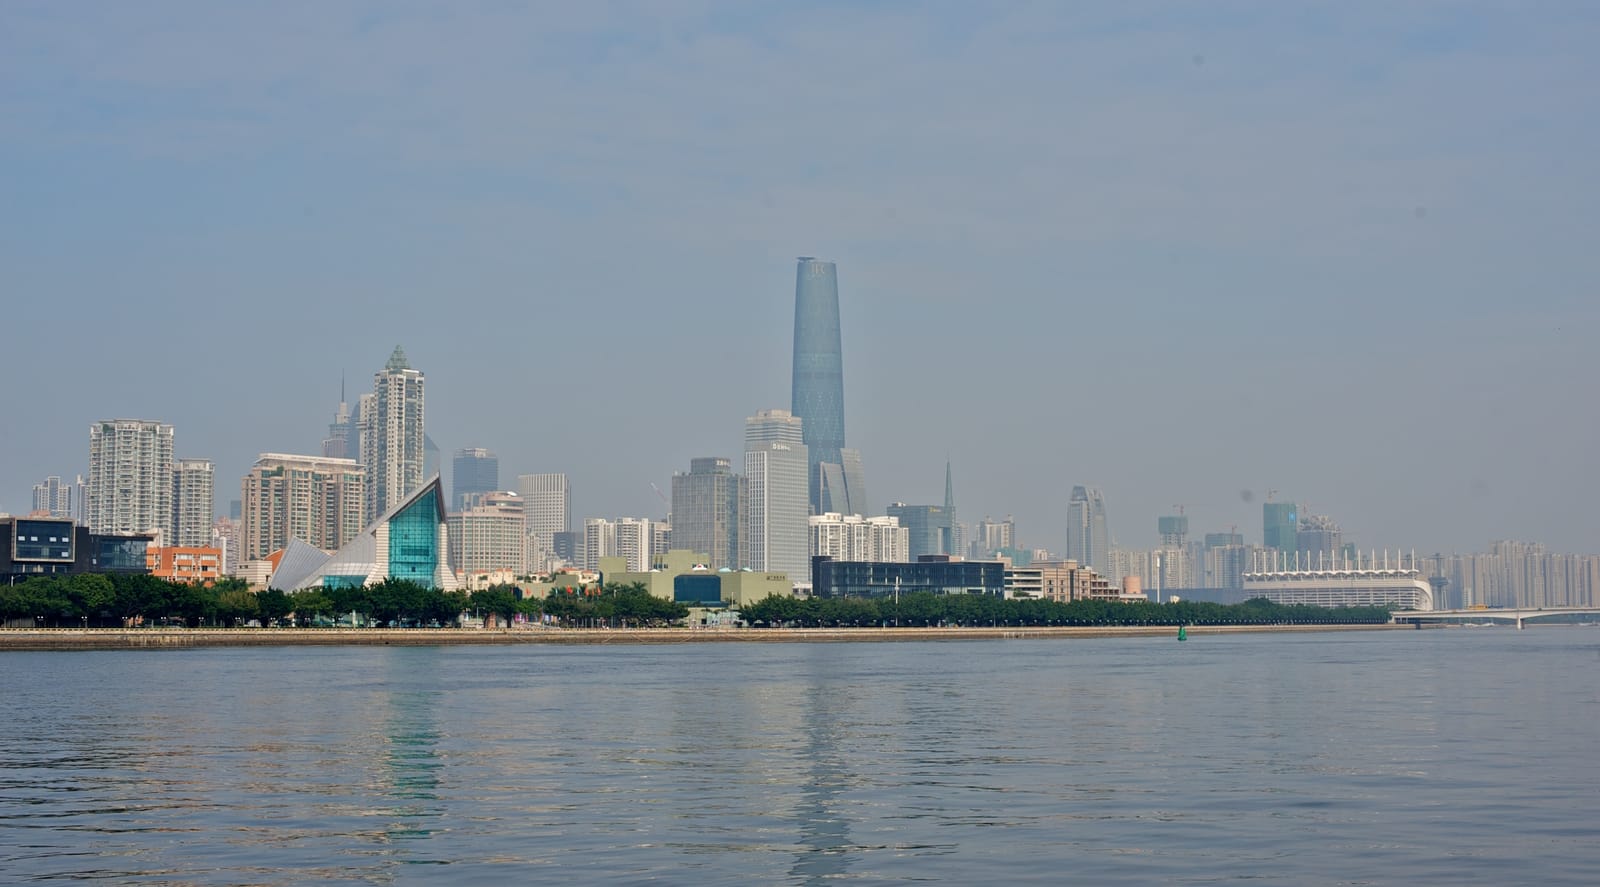 Tier 1
 · South · Guangzhou
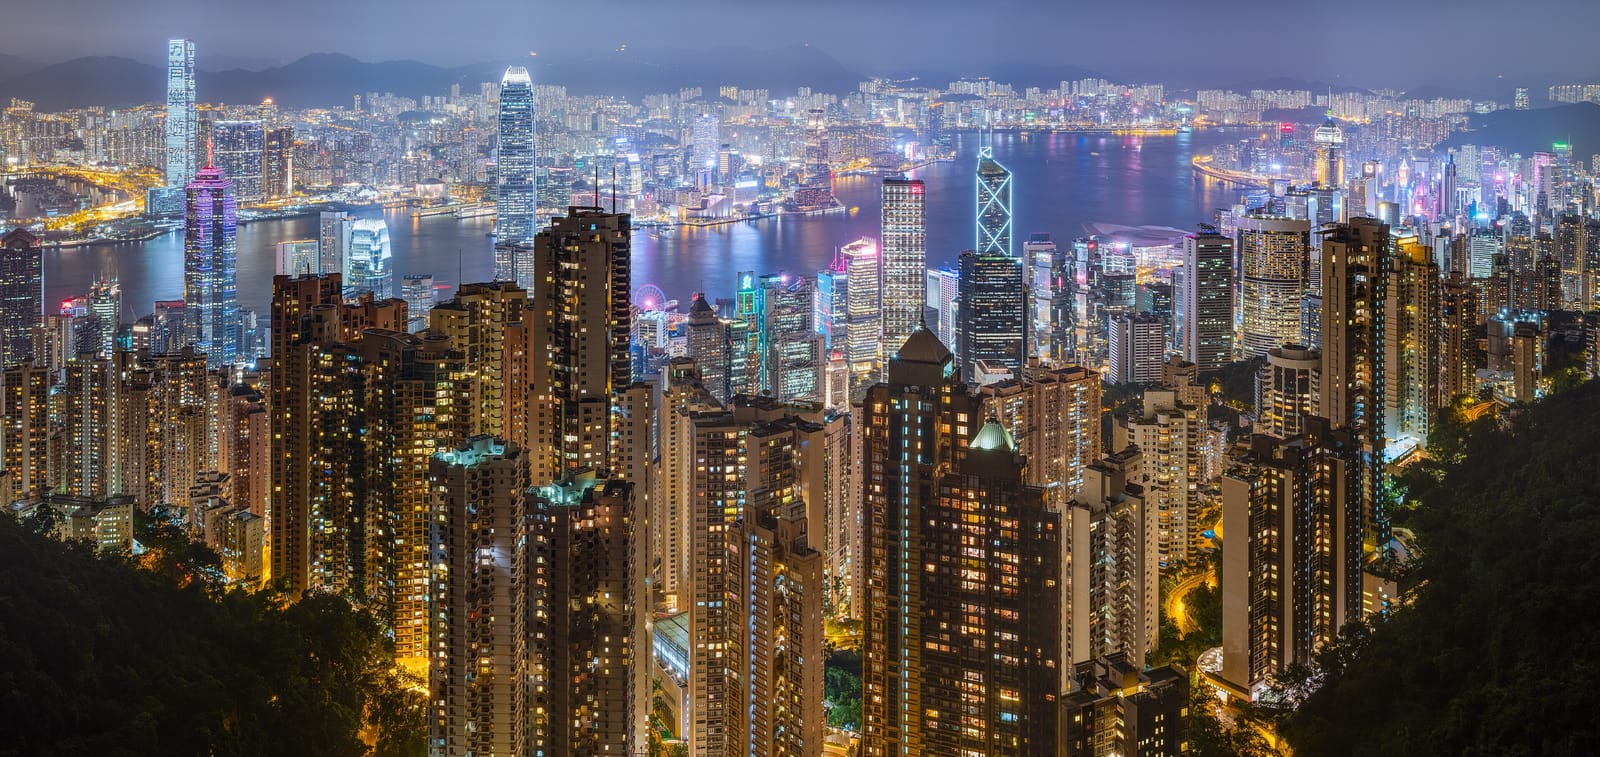 Tier 1
 · South · Hong Kong
 New Tier 1
 · East · Suzhou
 New Tier 1
 · Southwest · Chengdu
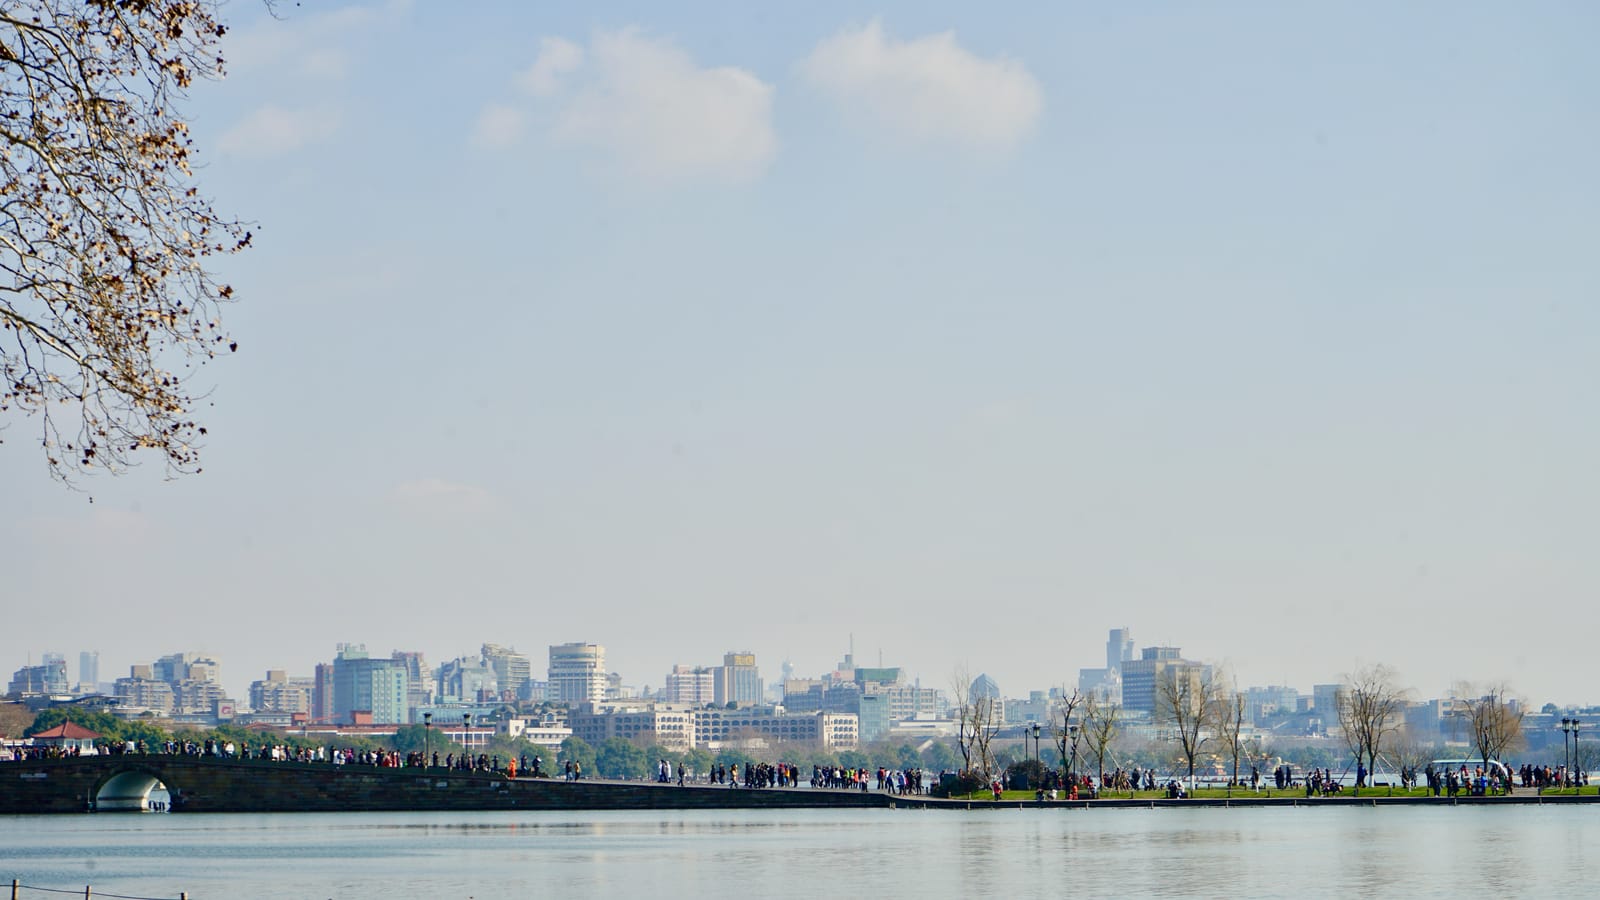 New Tier 1
 · East · Hangzhou
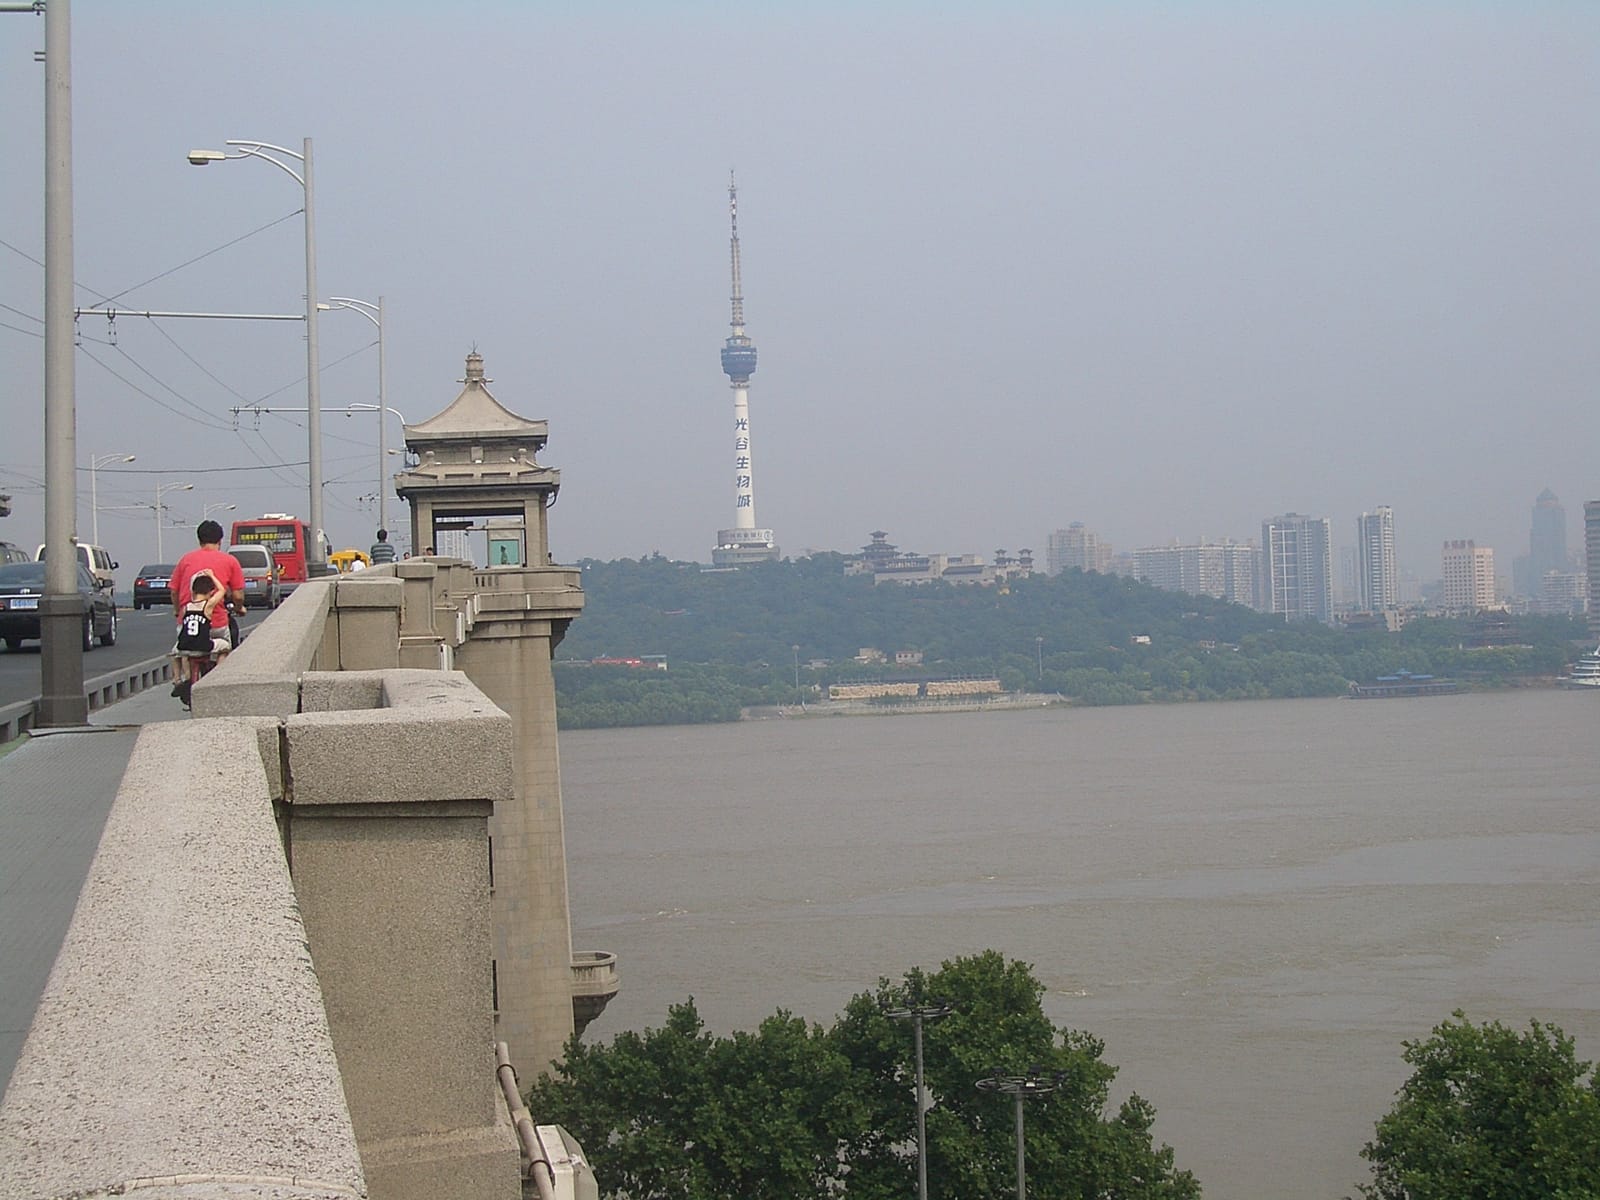 New Tier 1
 · Central · Wuhan
 New Tier 1
 · East · Ningbo
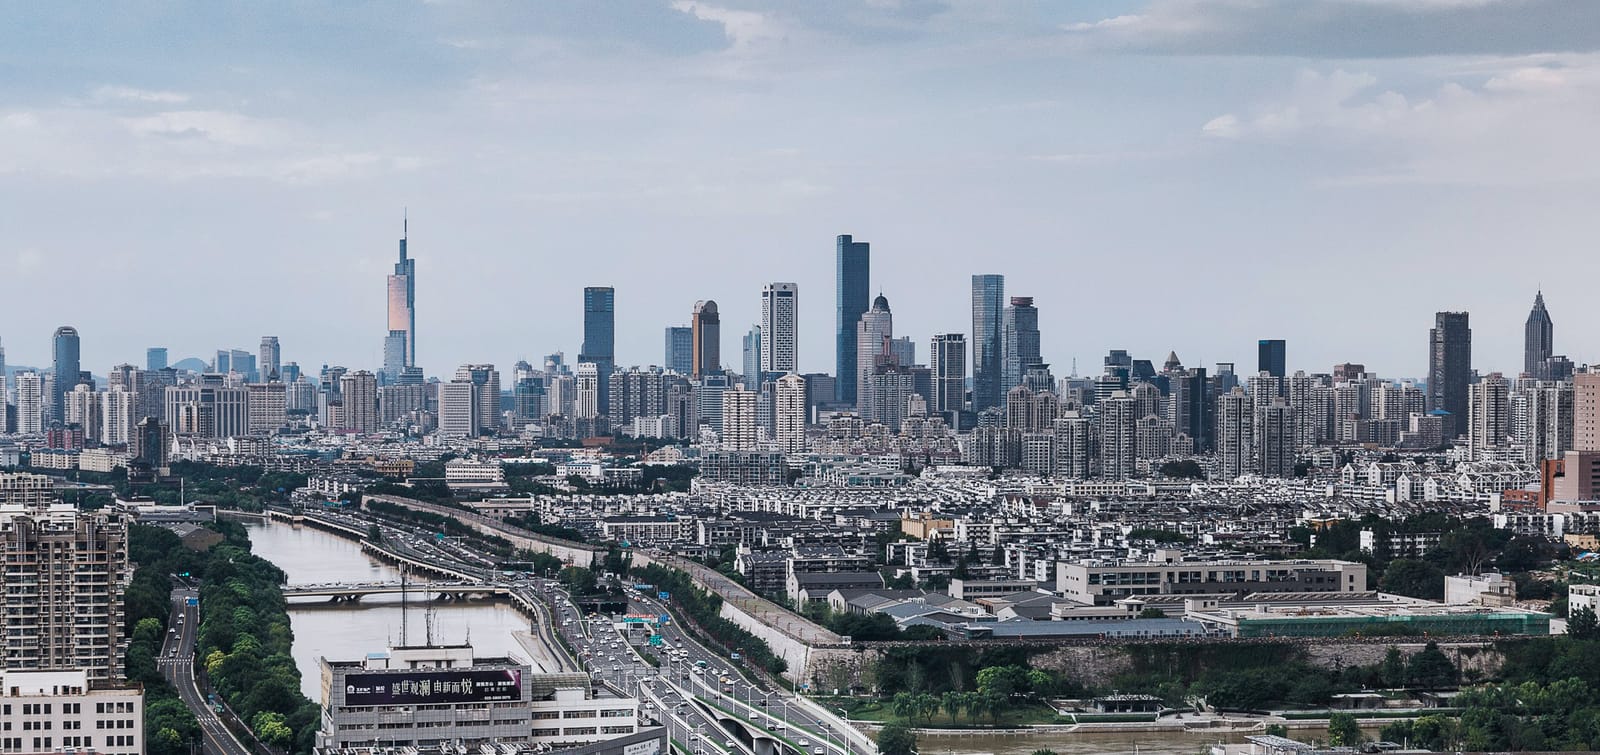 New Tier 1
 · East · Nanjing
 New Tier 1
 · East · Wuxi
 New Tier 1
 · East · Qingdao
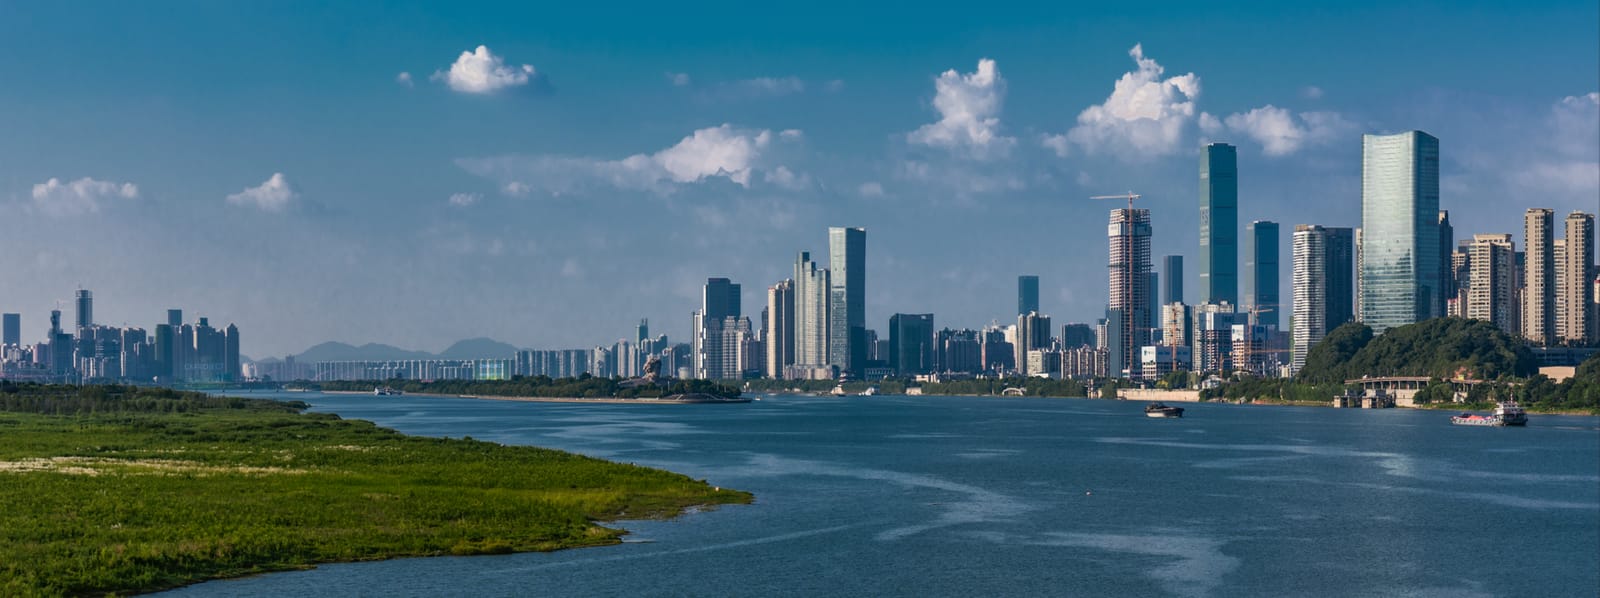 New Tier 1
 · Central · Changsha
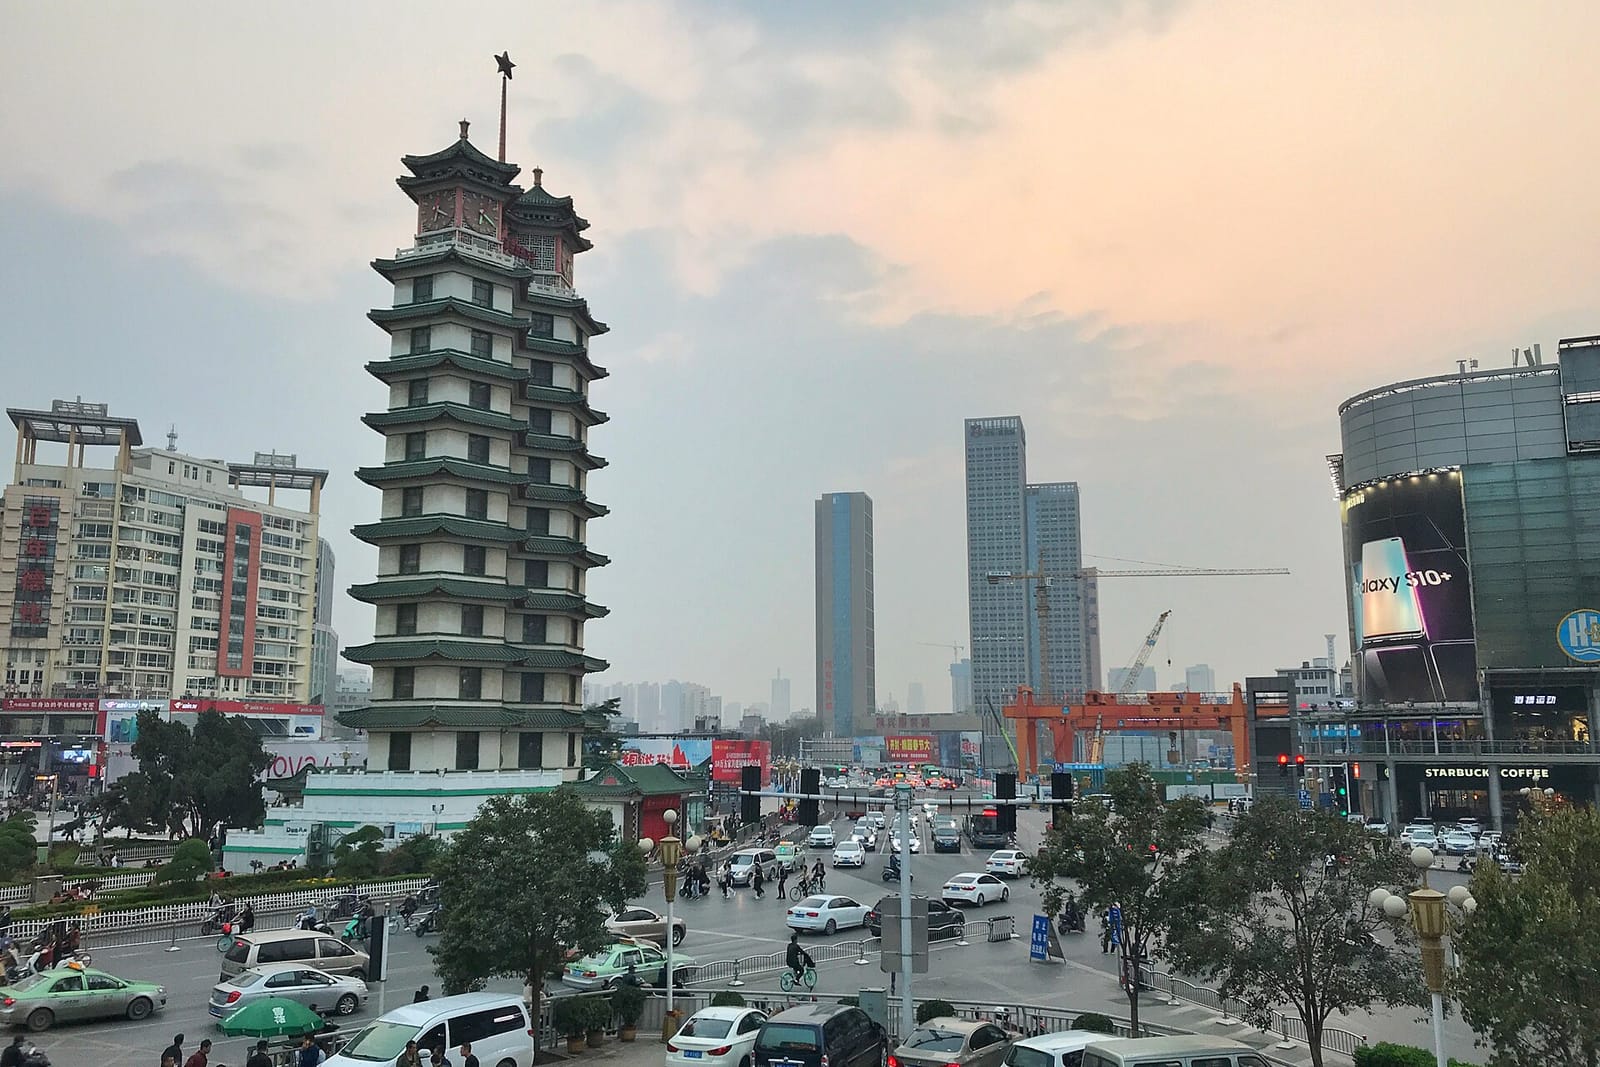 New Tier 1
 · Central · Zhengzhou
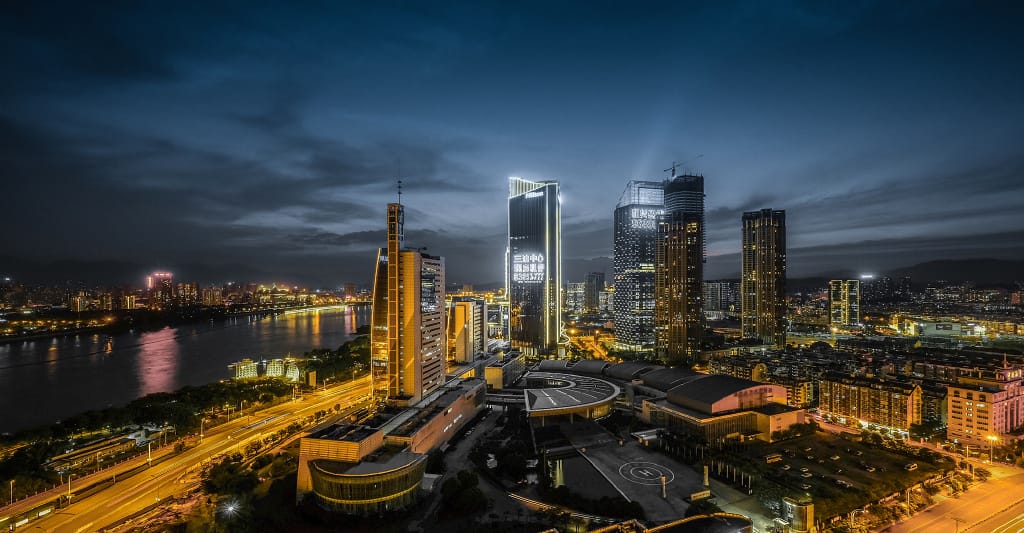 New Tier 1
 · East · Fuzhou
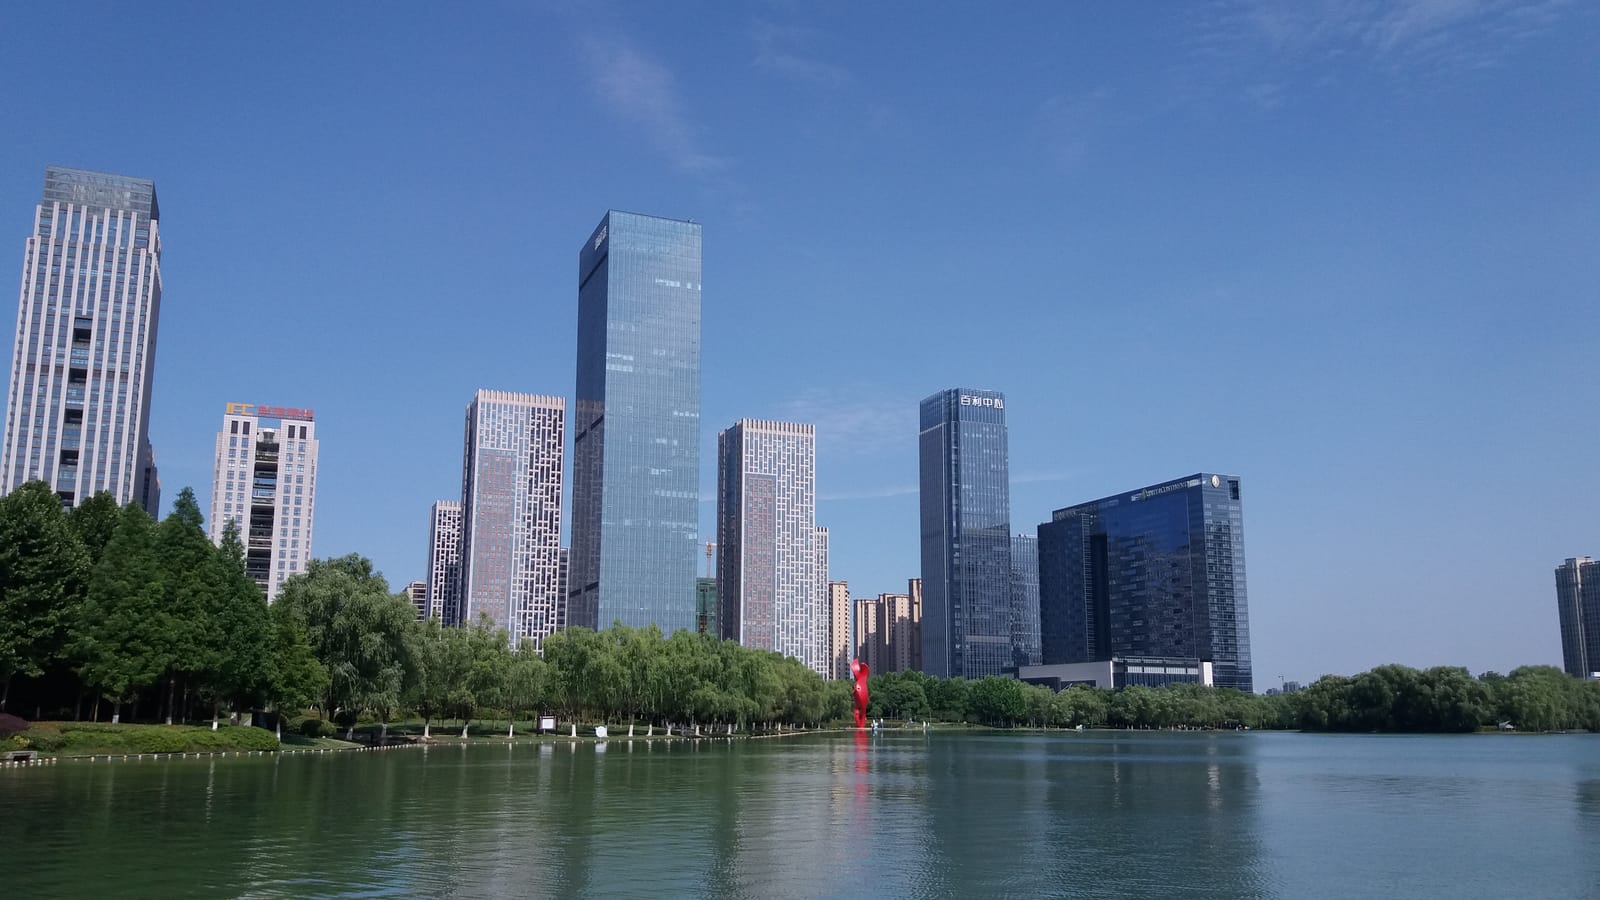 New Tier 1
 · East · Hefei
 New Tier 1
 · Northwest · Xi'an
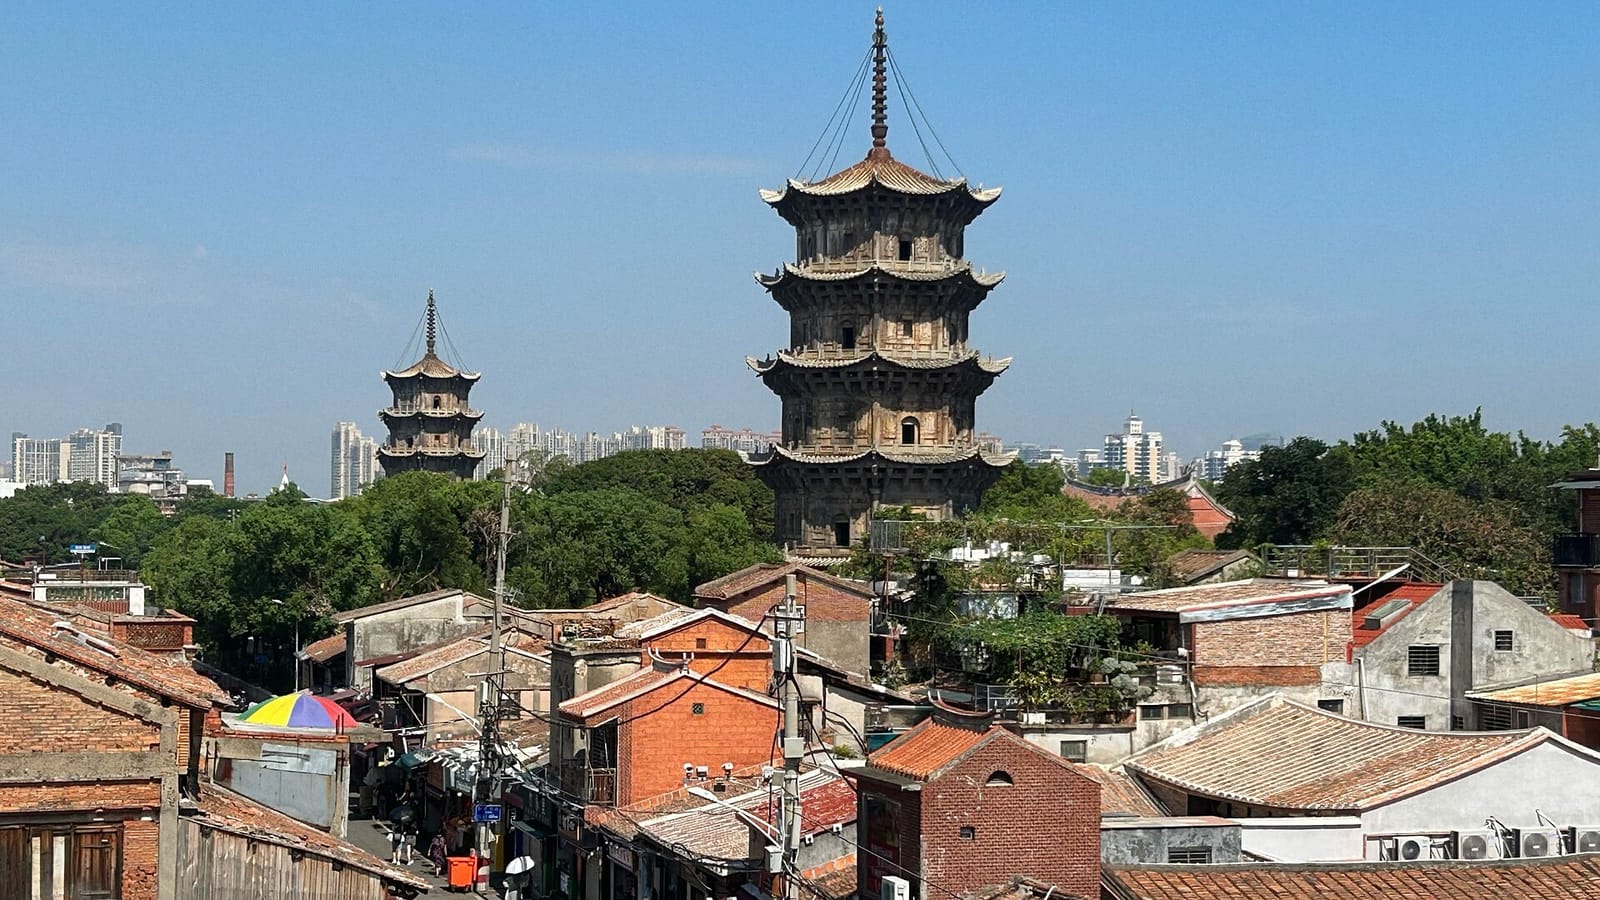 Tier 2
 · East · Quanzhou
 New Tier 1
 · East · Jinan
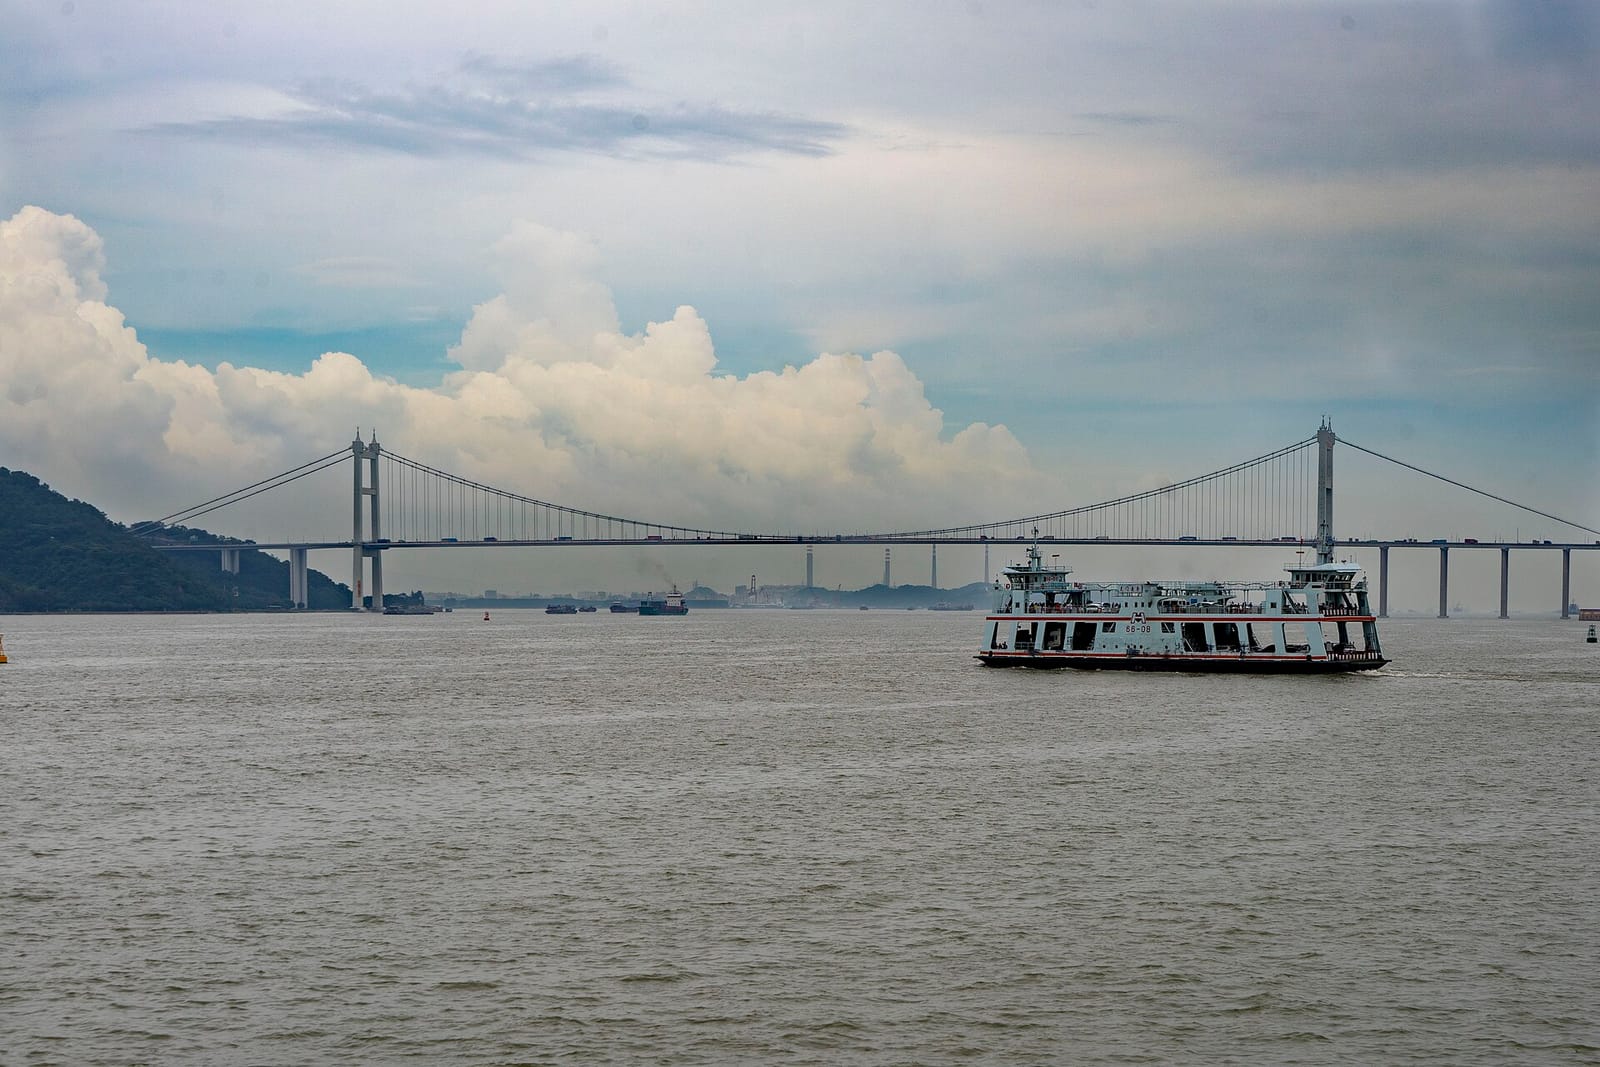 New Tier 1
 · South · Dongguan
 New Tier 1
 · South · Foshan
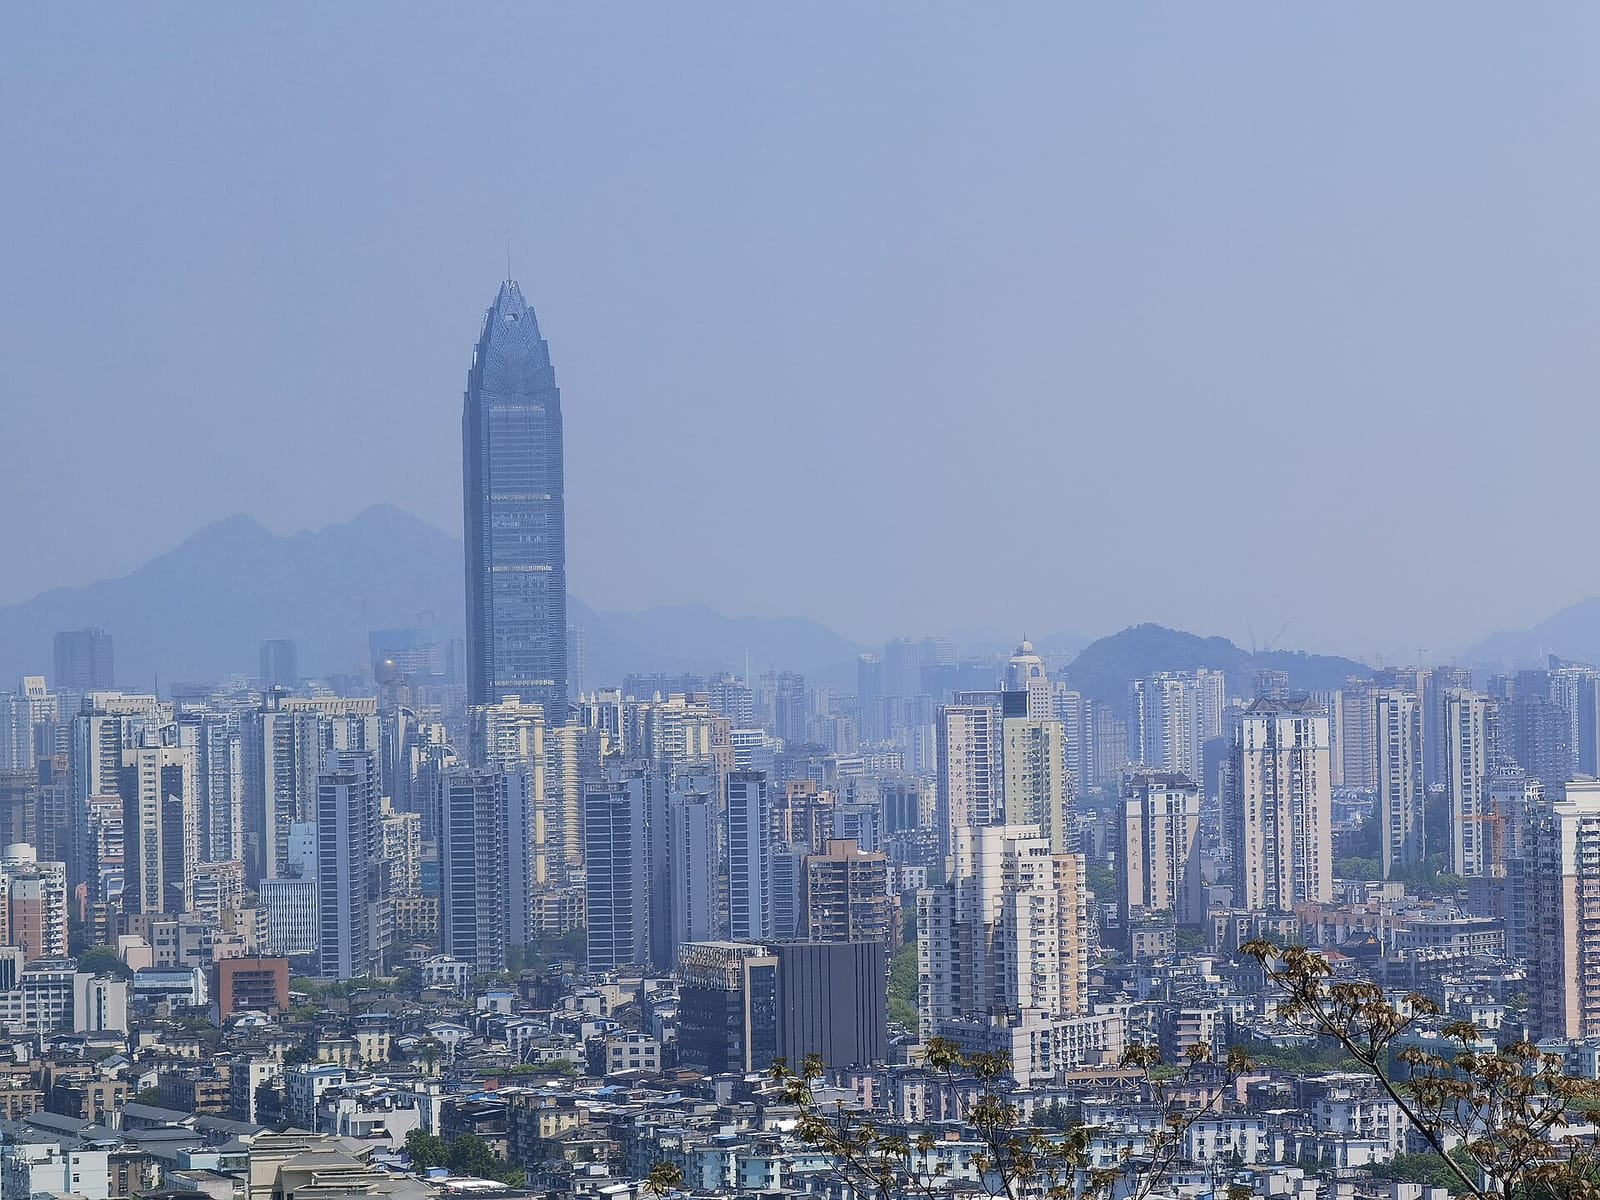 Tier 2
 · East · Wenzhou
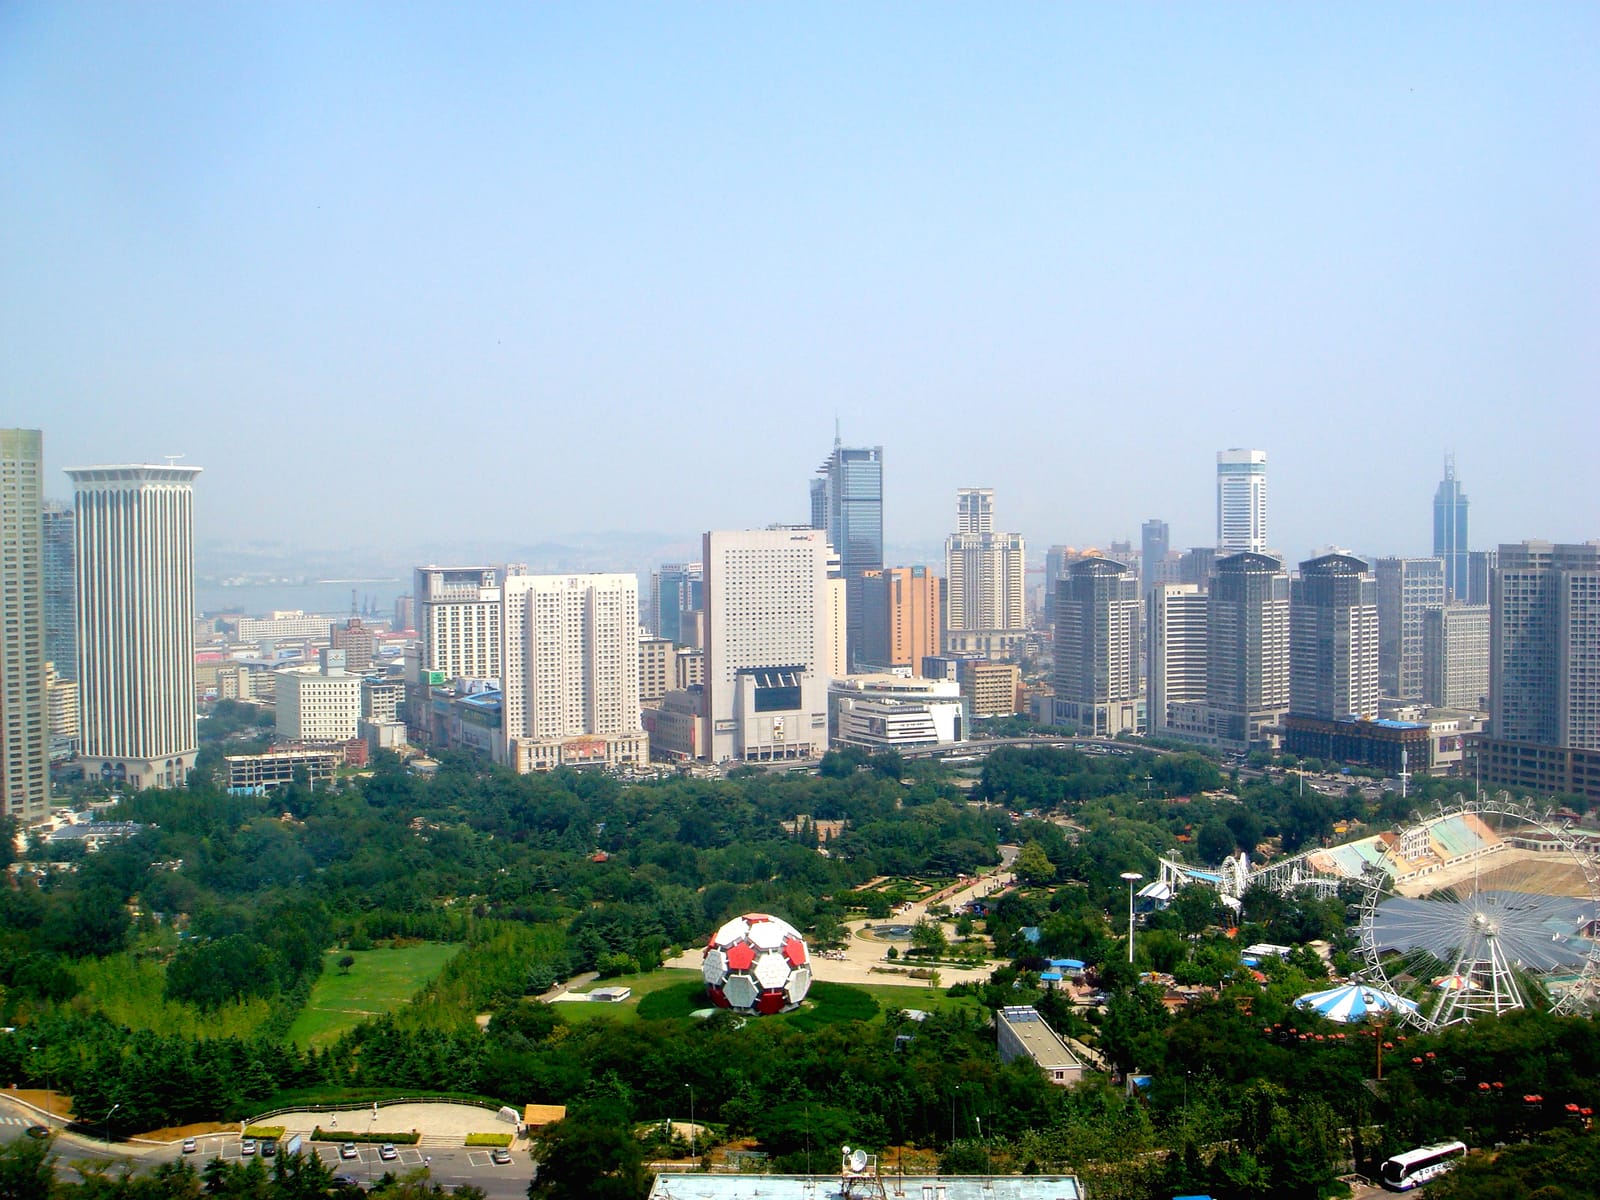 New Tier 1
 · Northeast · Dalian
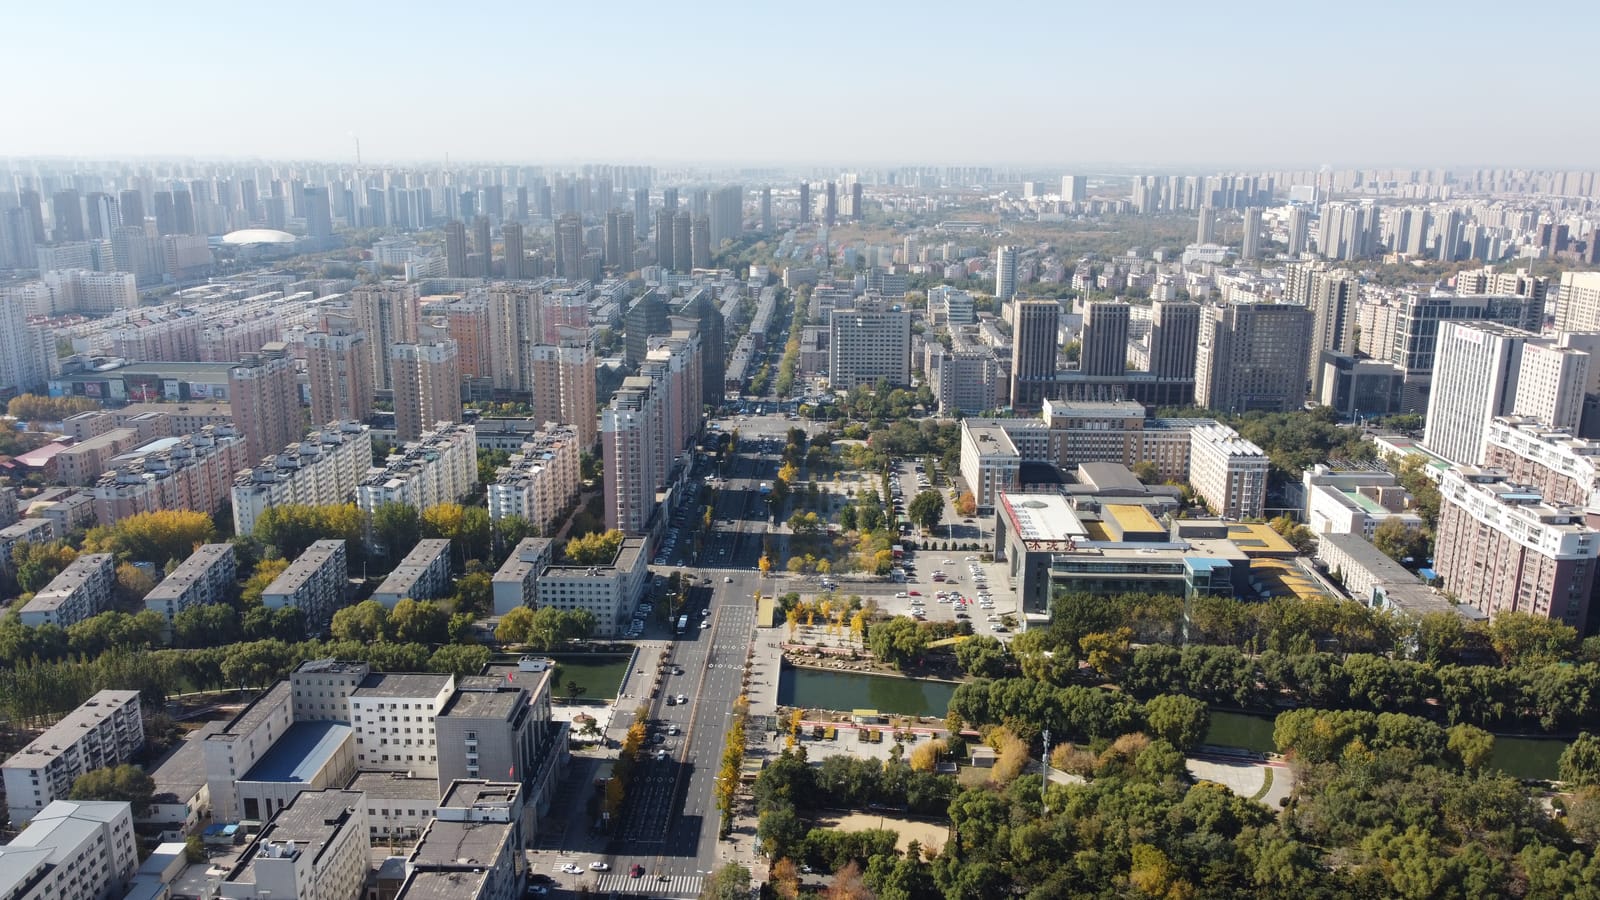 New Tier 1
 · Northeast · Shenyang
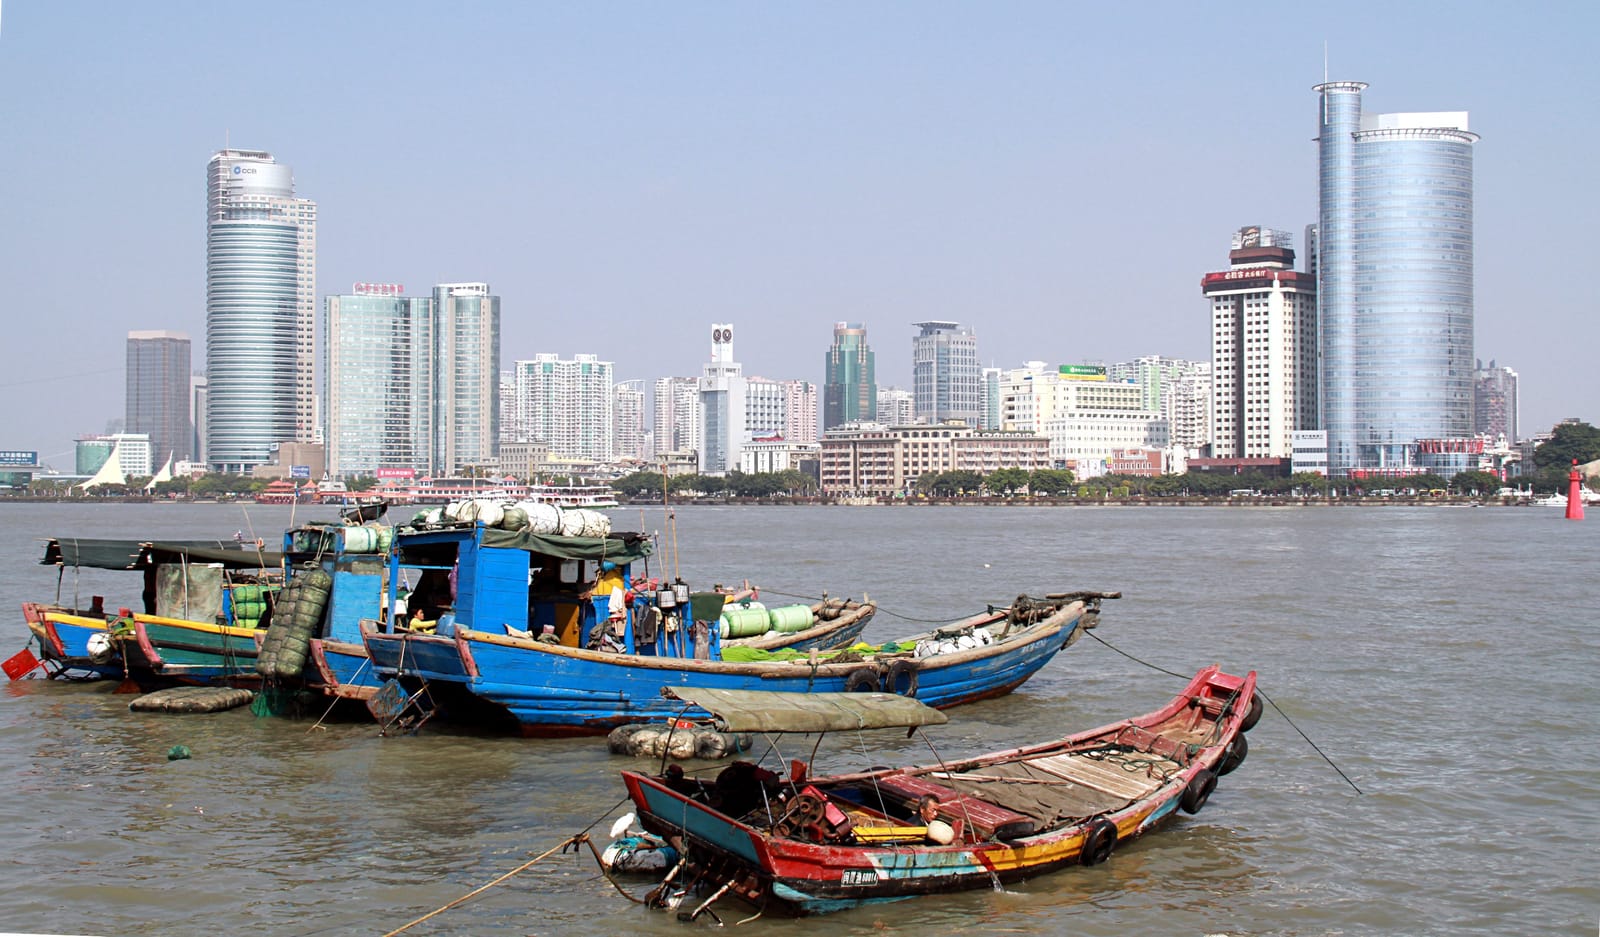 New Tier 1
 · East · Xiamen
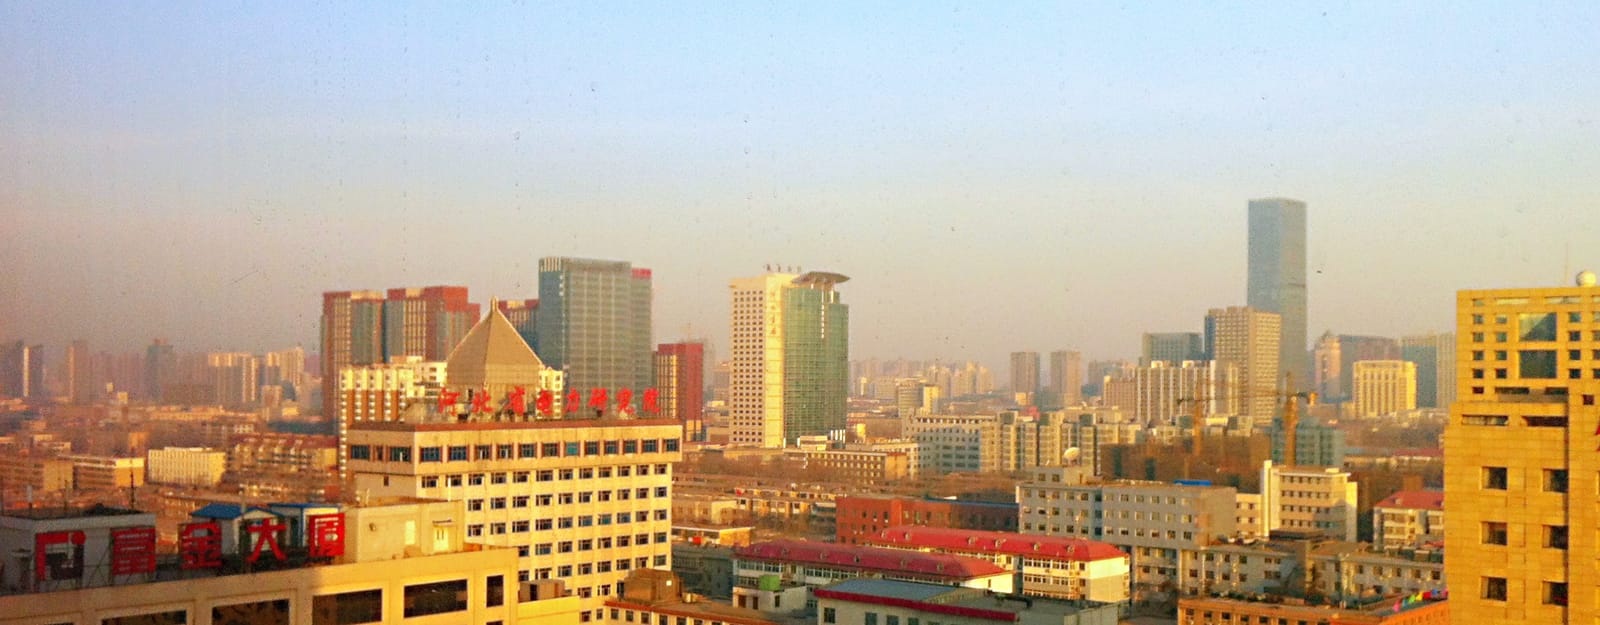 Tier 2
 · North · Shijiazhuang
 New Tier 1
 · Southwest · Kunming
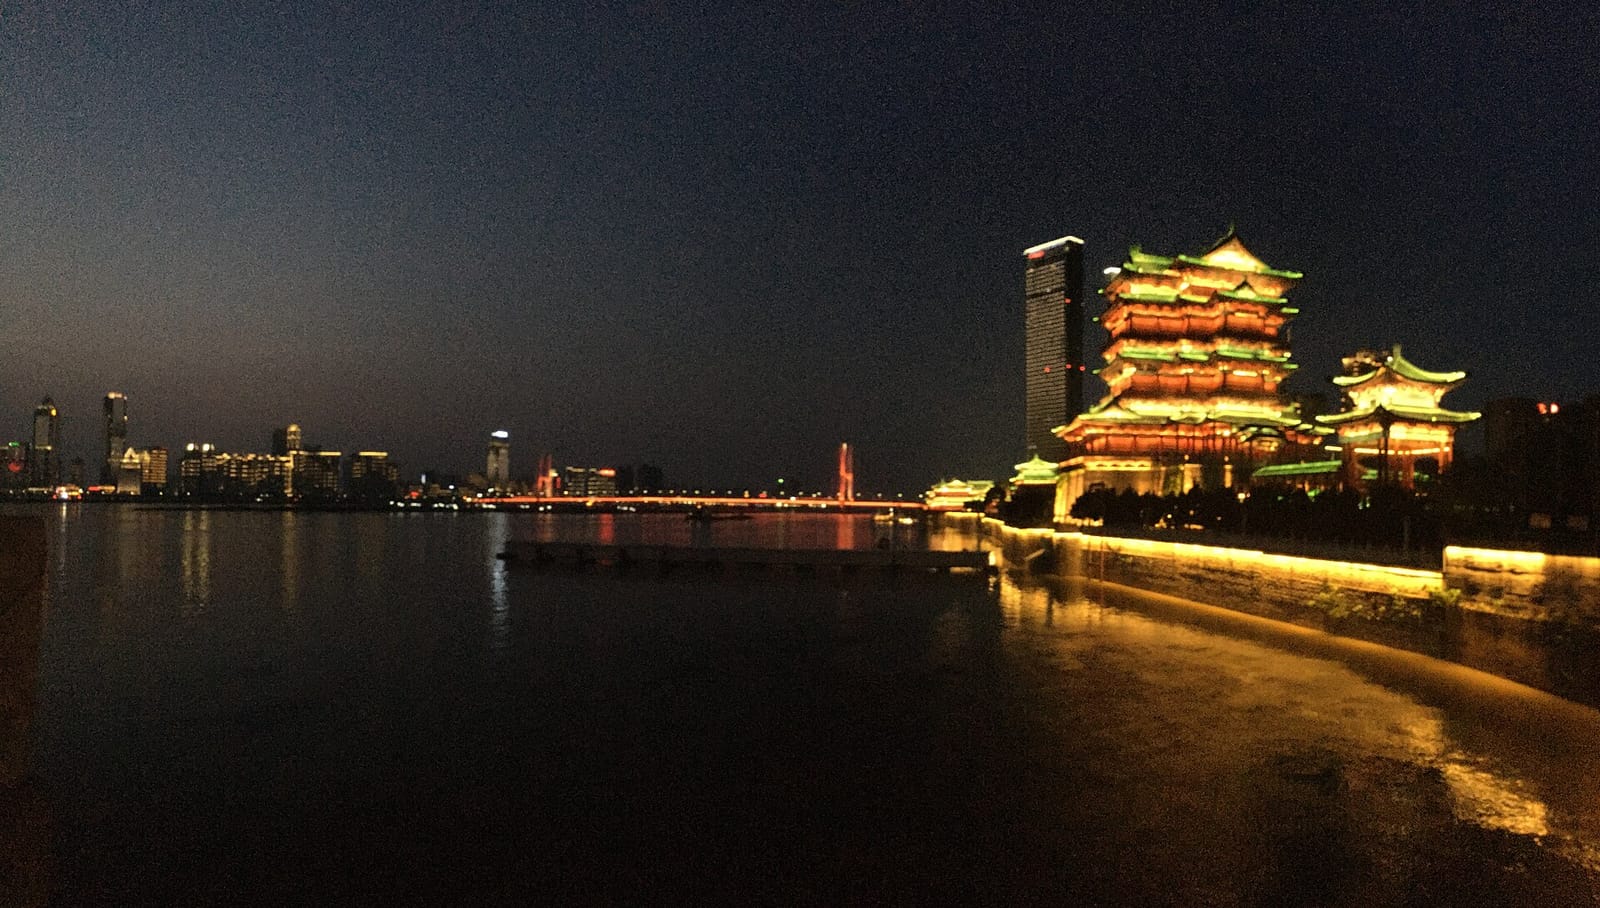 Tier 2
 · East · Nanchang
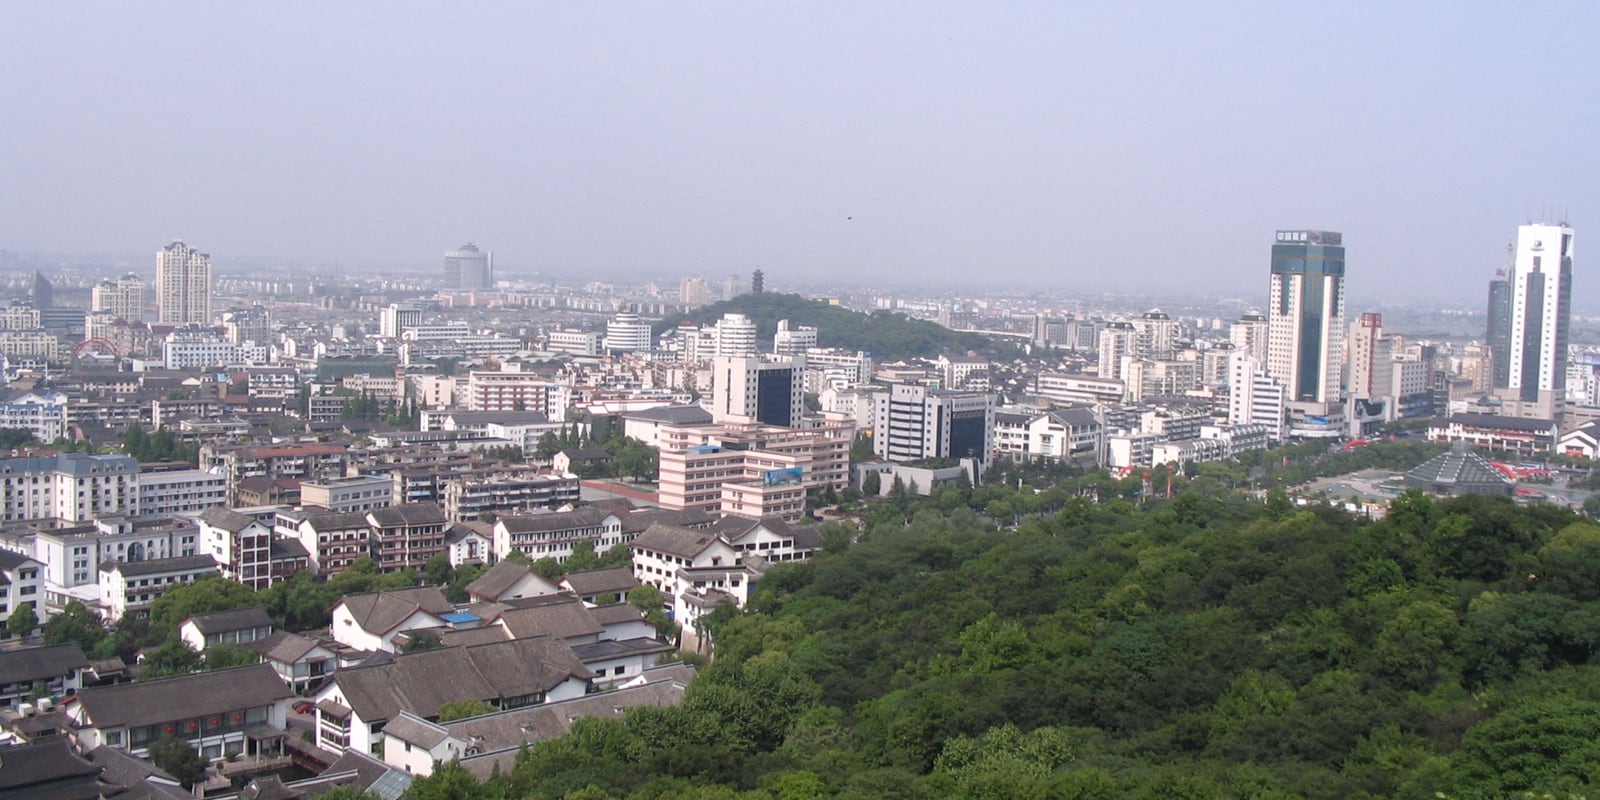 Tier 3
 · East · Shaoxing
 Tier 2
 · Northeast · Changchun
 Tier 3
 · East · Yangzhou
 Tier 3
 · East · Jiaxing
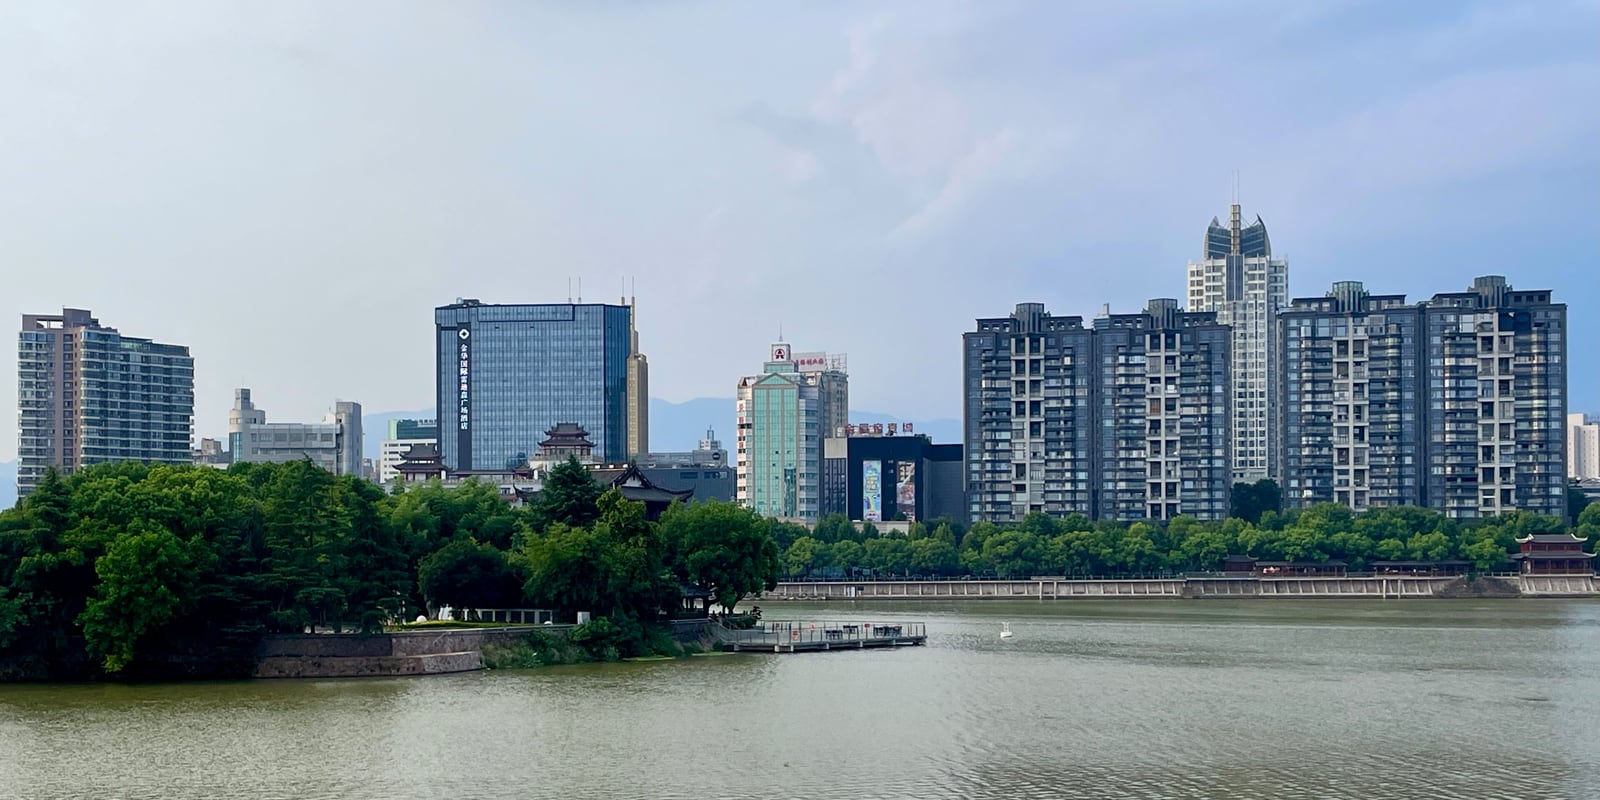 Tier 3
 · East · Jinhua
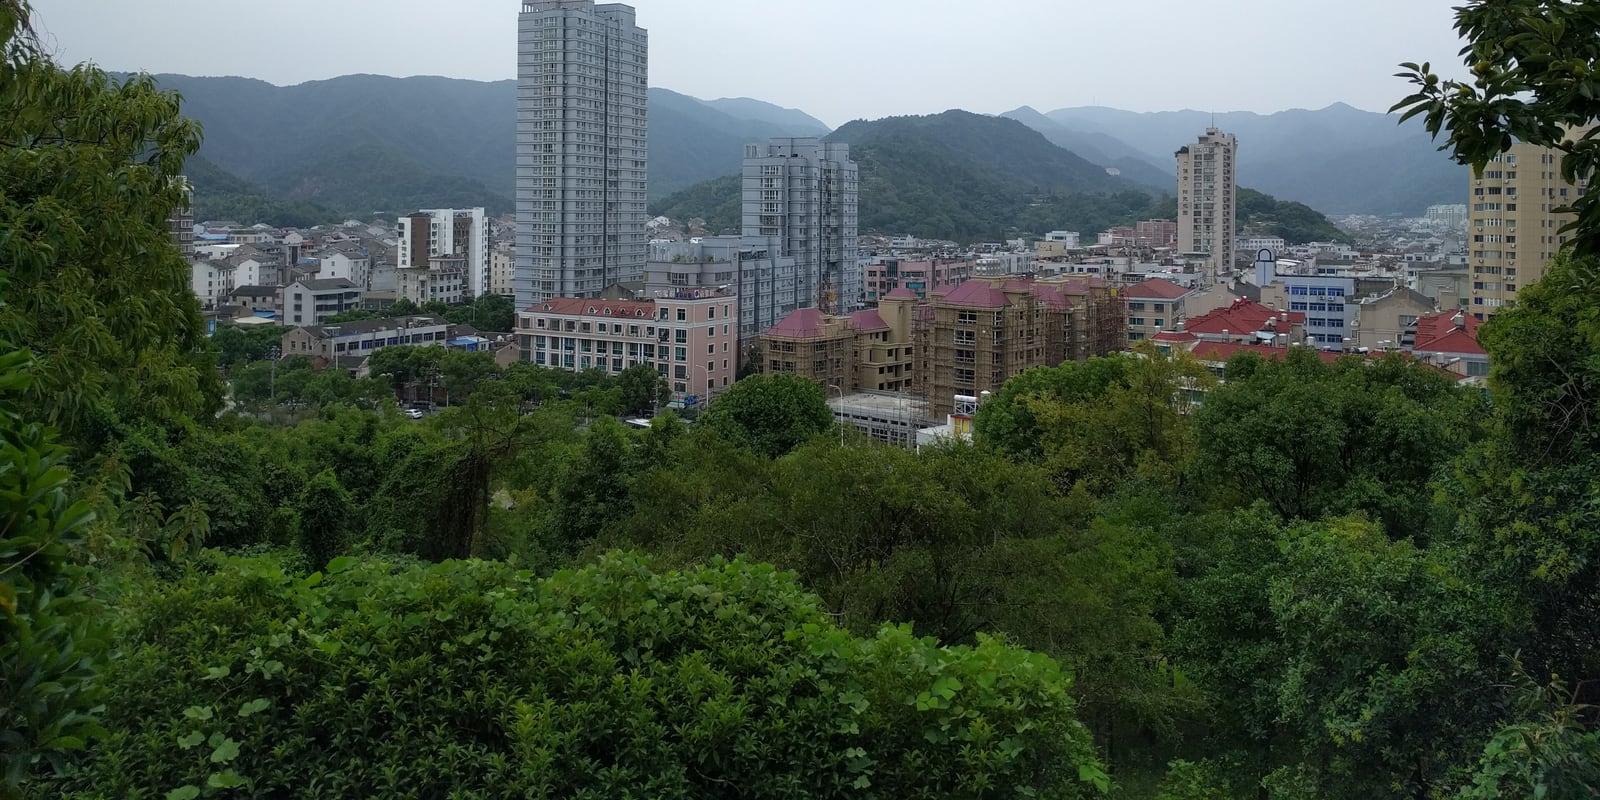 Tier 3
 · East · Taizhou
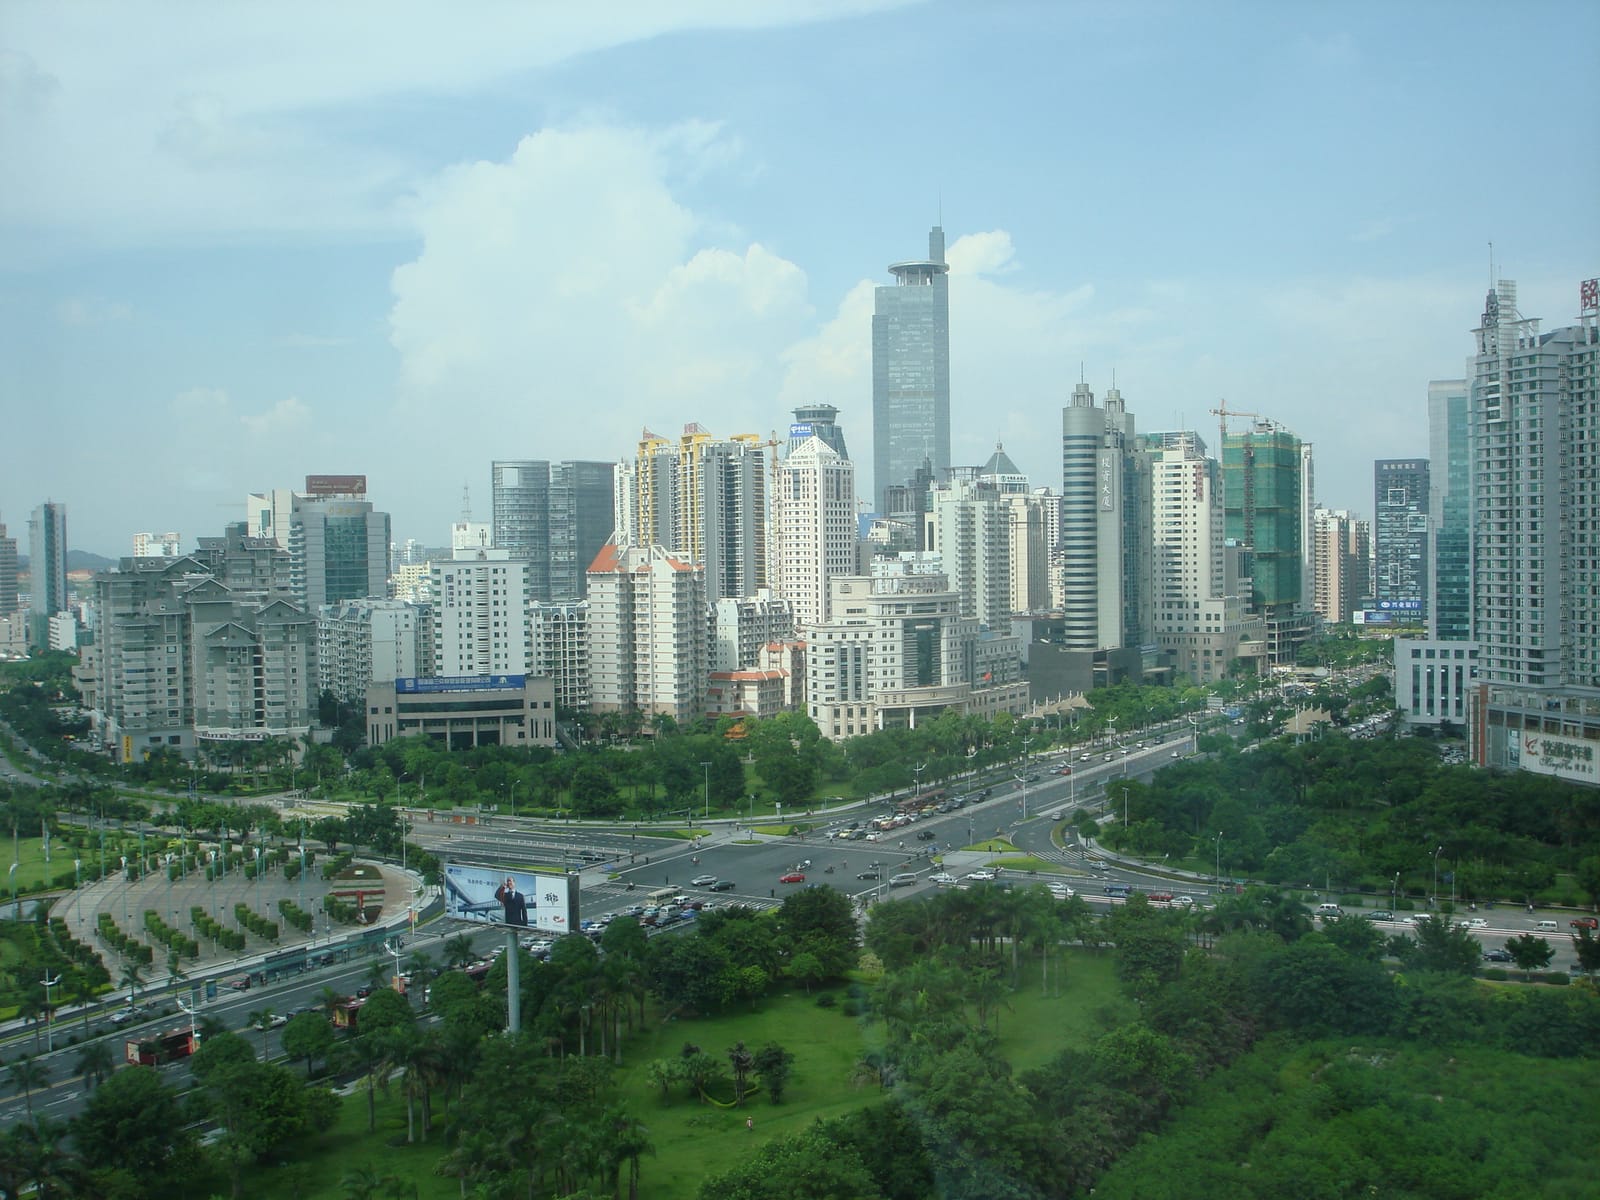 Tier 2
 · South · Nanning
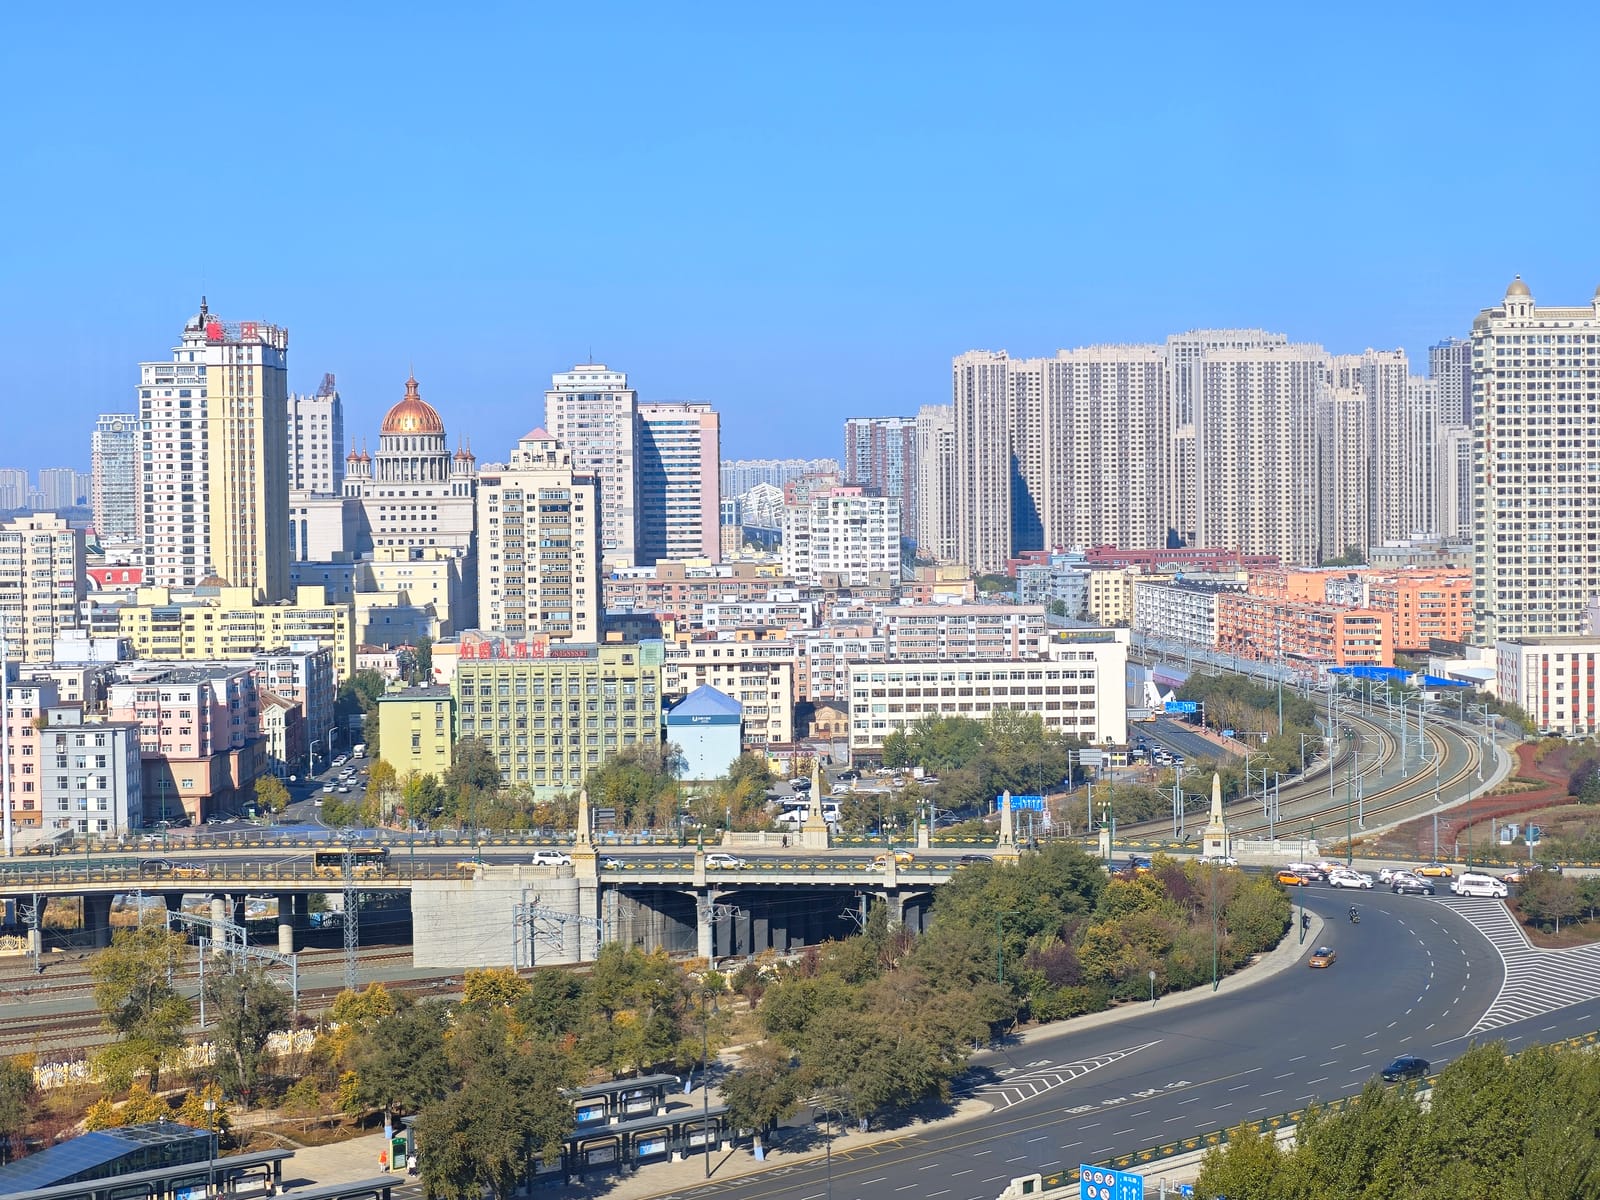 Tier 2
 · Northeast · Harbin
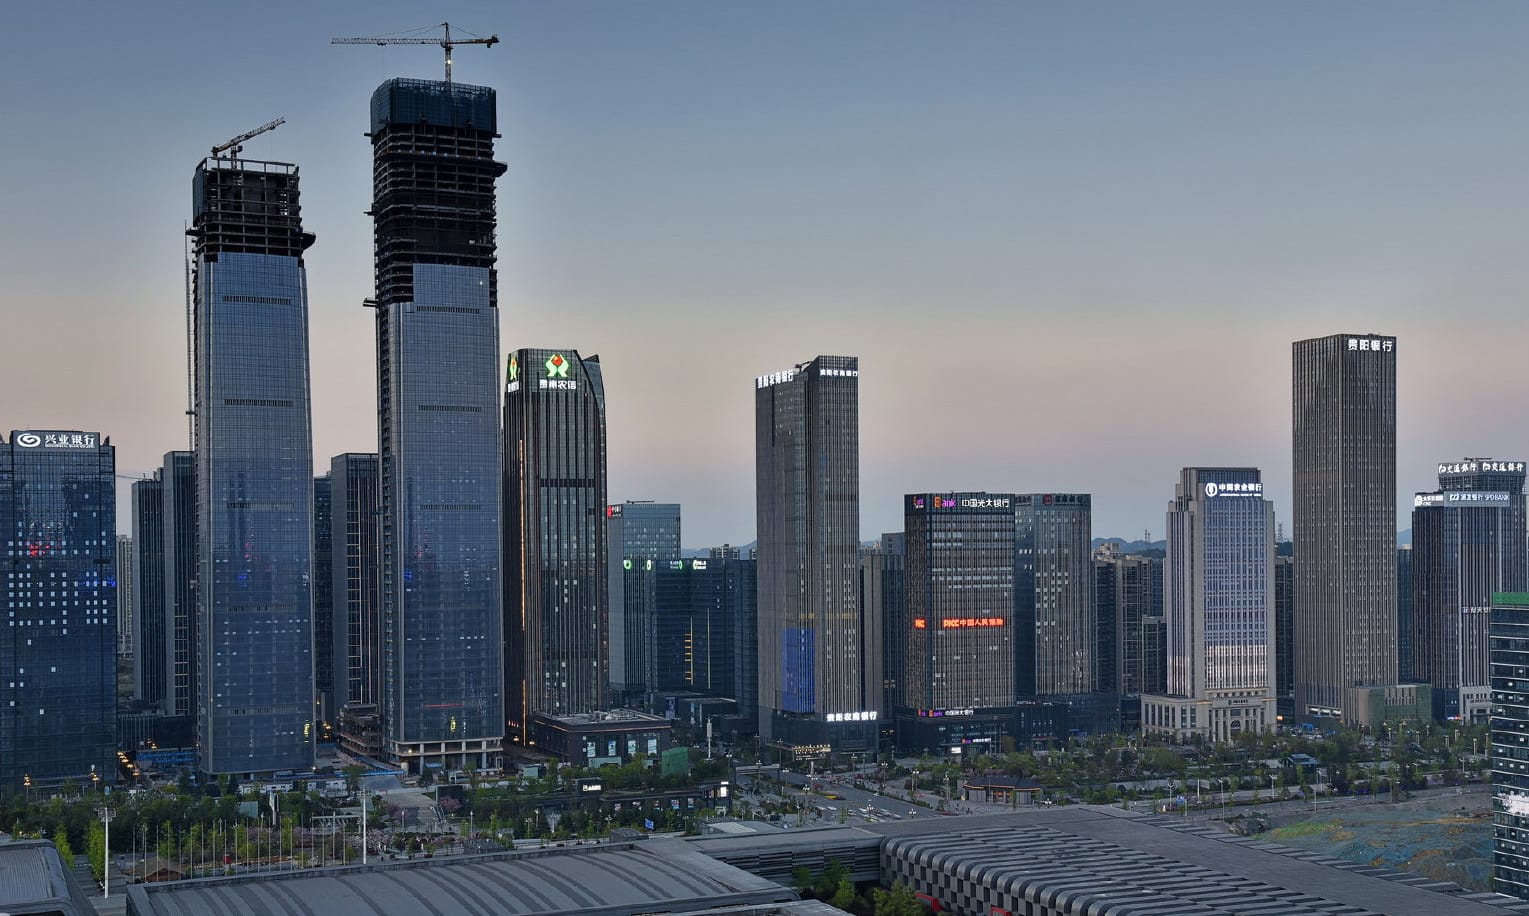 Tier 2
 · Southwest · Guiyang
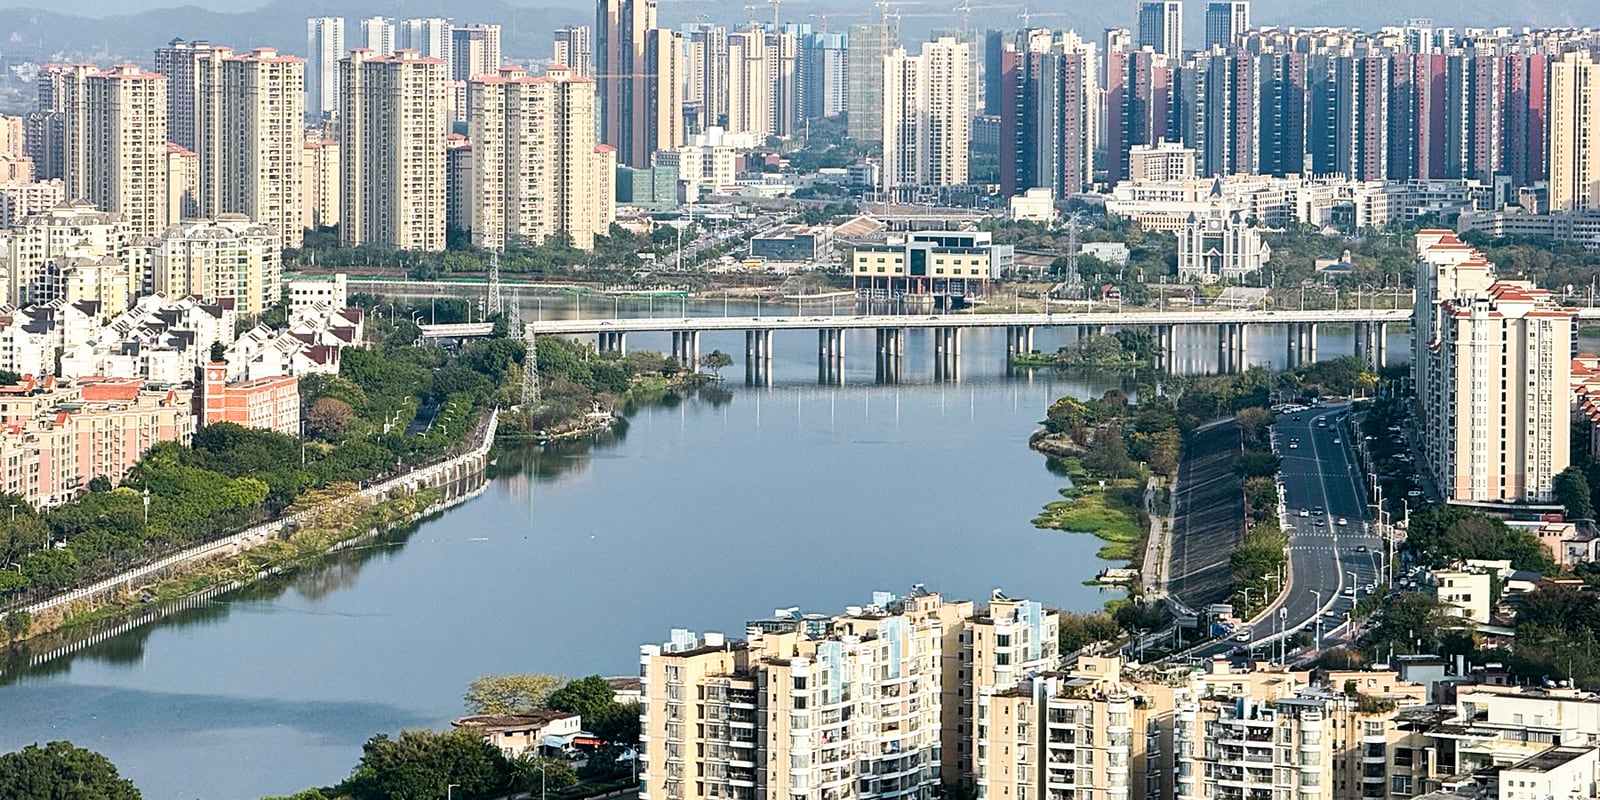 Tier 3
 · South · Huizhou
 Tier 3
 · Central · Luoyang
 Tier 2
 · North · Taiyuan
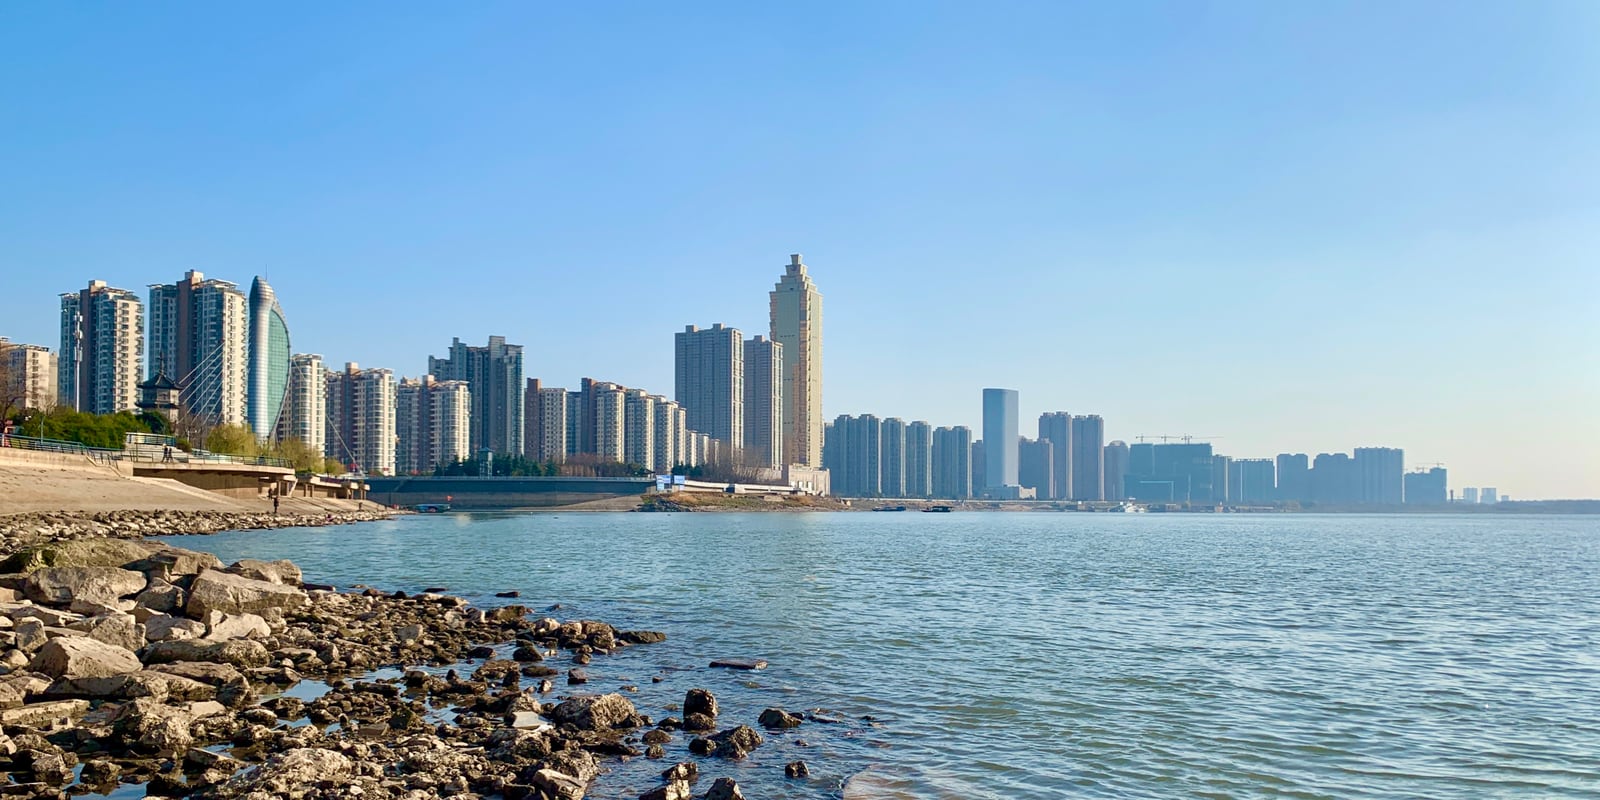 Tier 3
 · East · Wuhu
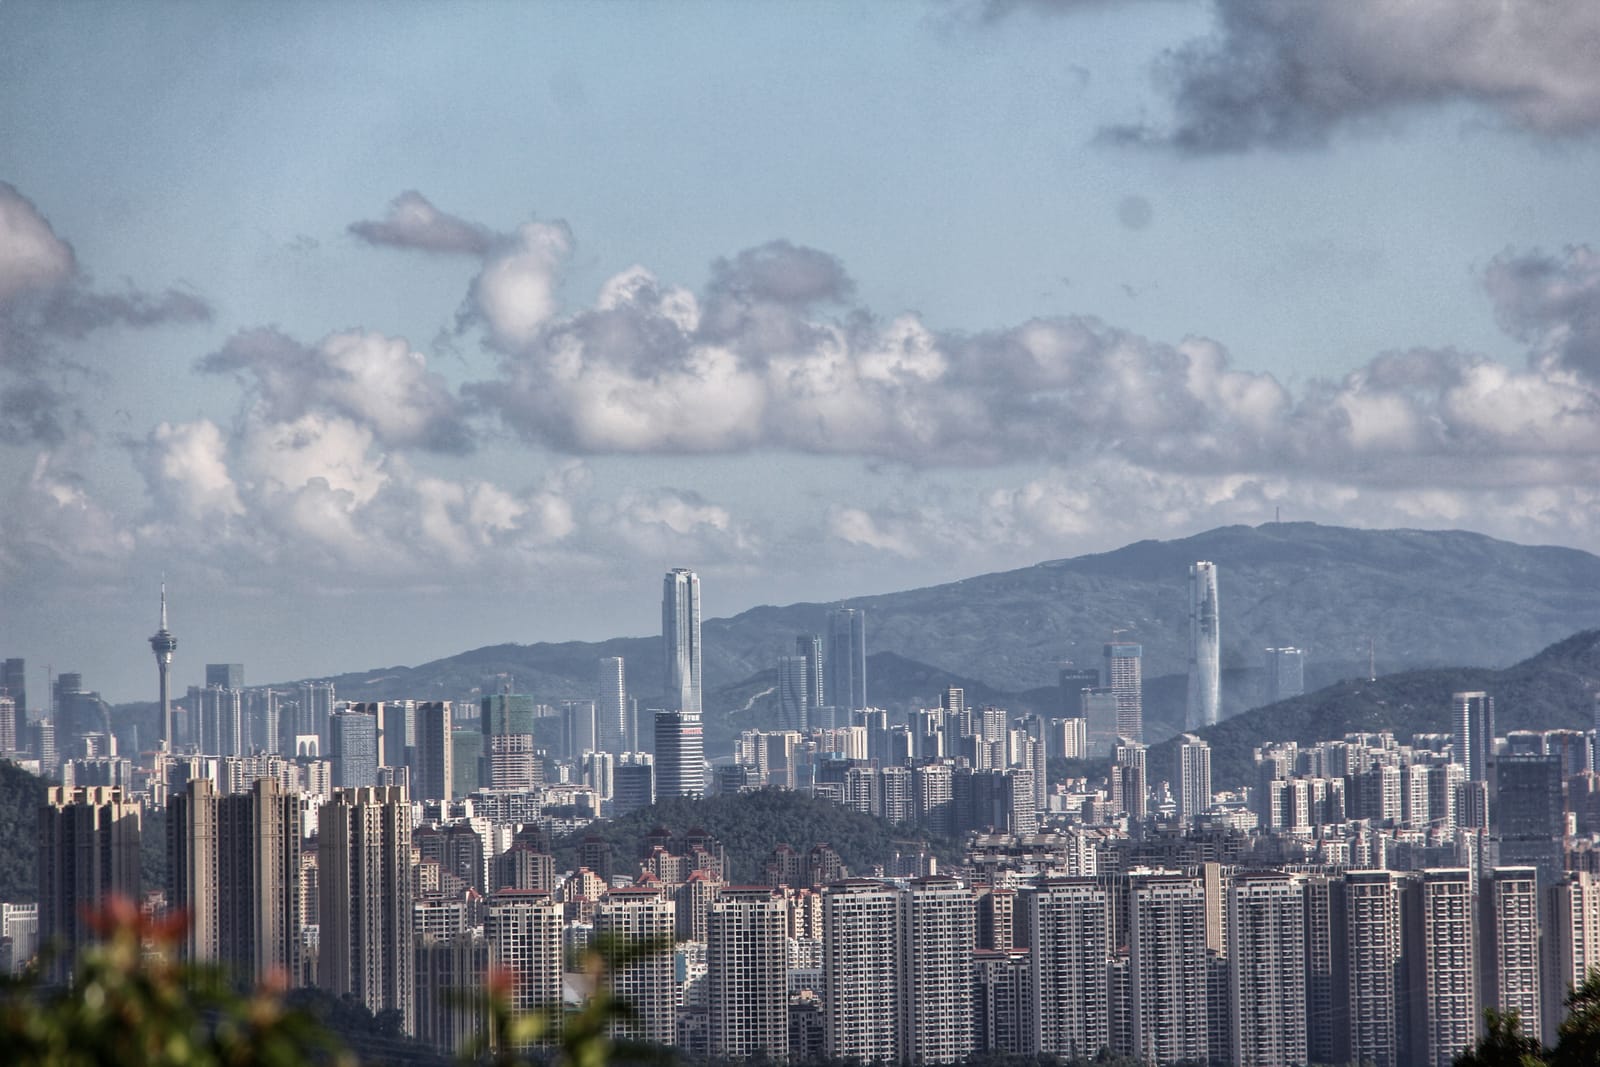 Tier 2
 · South · Zhuhai
 Tier 2
 · Northwest · Urumqi
 Tier 2
 · North · Hohhot
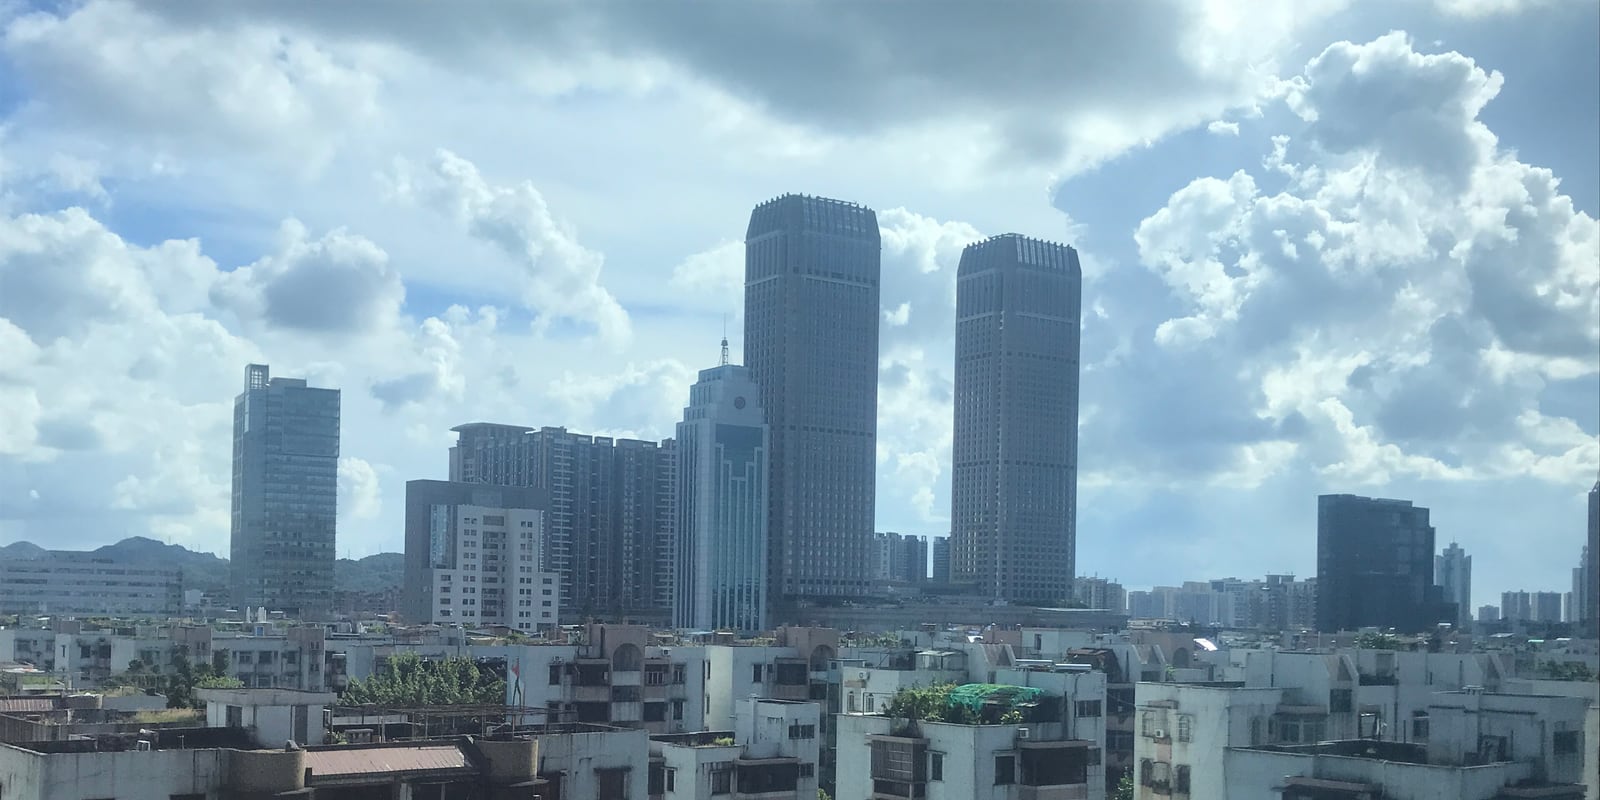 Tier 3
 · South · Zhongshan
 Tier 2
 · Northwest · Lanzhou
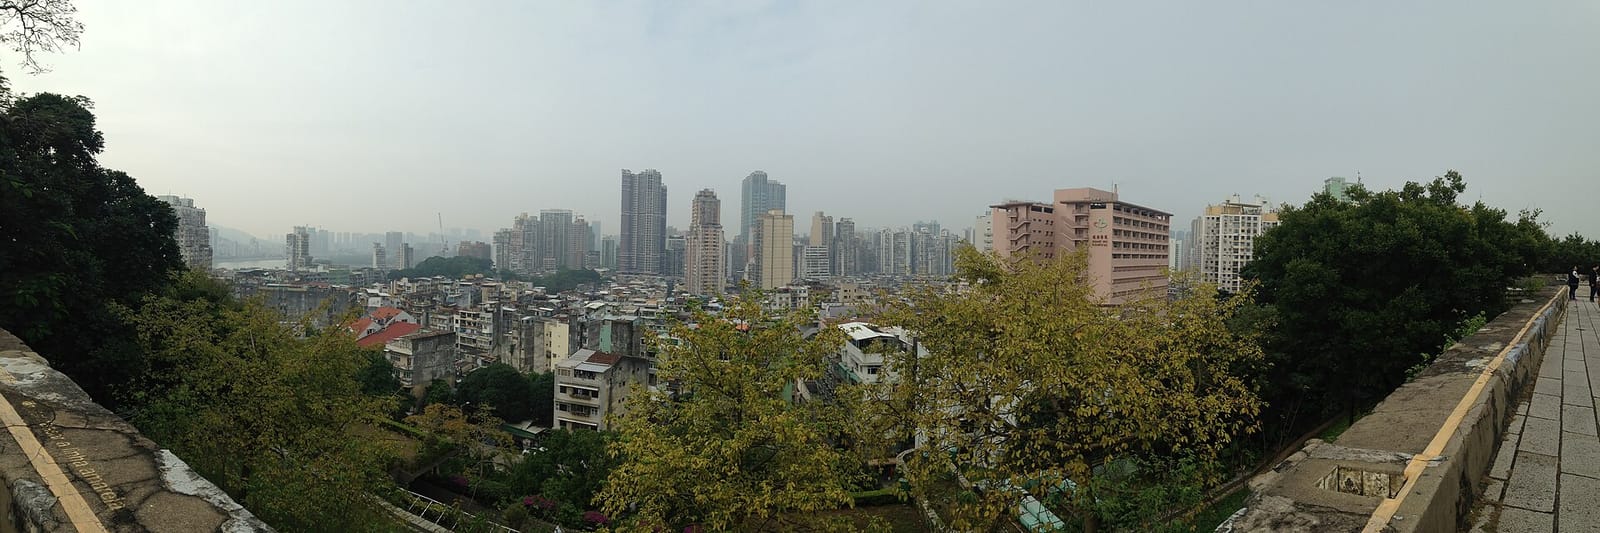 Tier 2
 · South · Macao
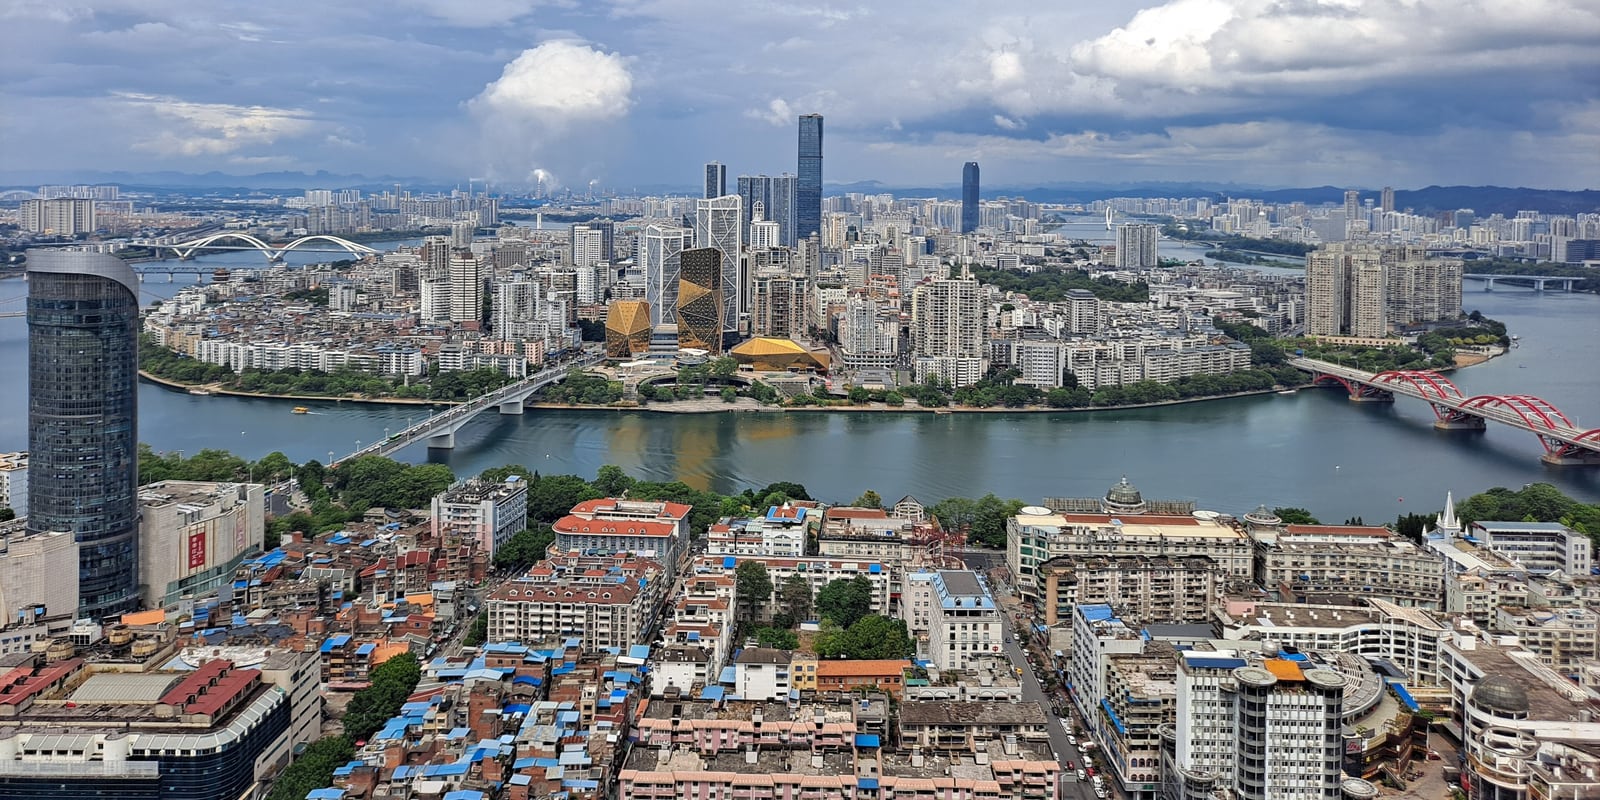 Tier 3
 · South · Liuzhou
 Tier 3
 · South · Guilin
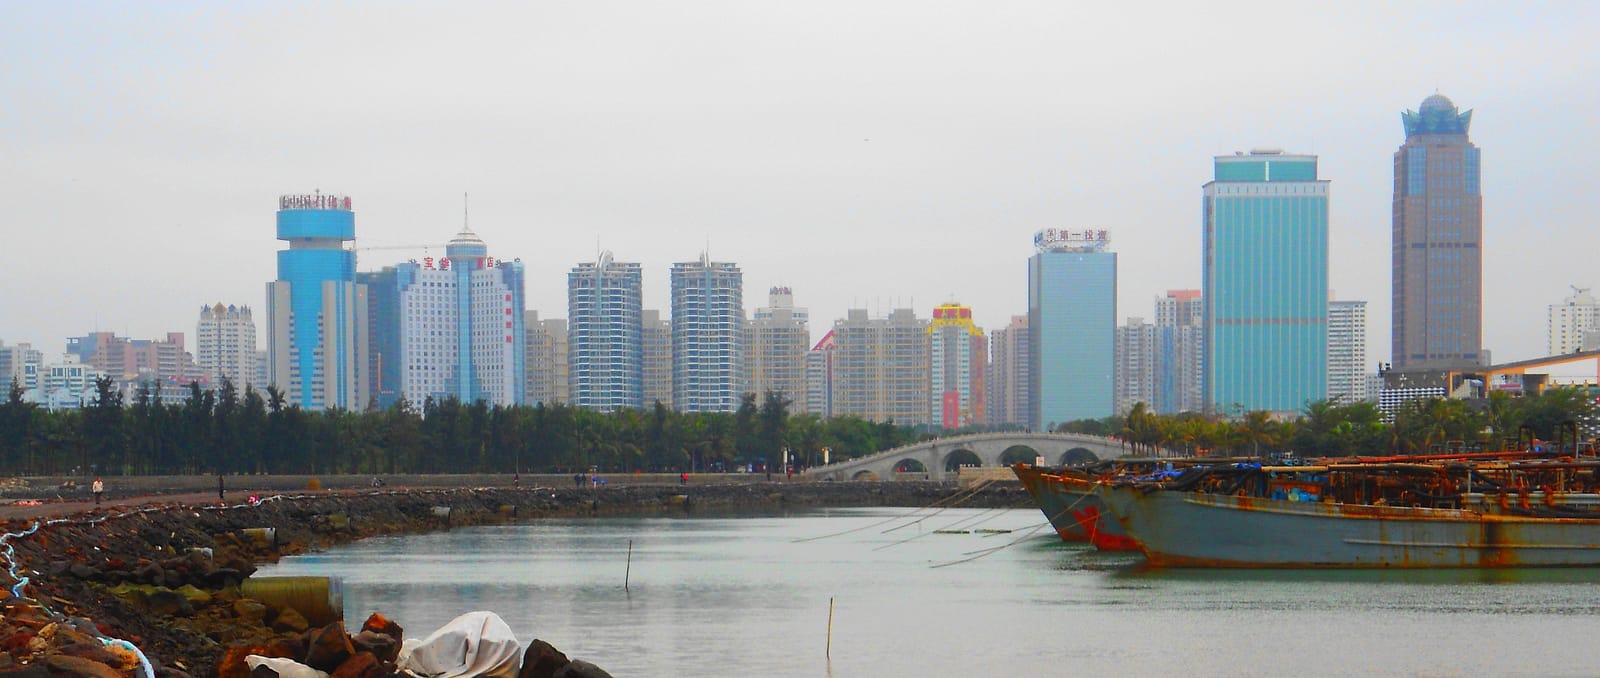 Tier 2
 · South · Haikou
 Tier 3
 · South · Sanya
Every city in this guide is scored on digital access, consumer depth, market scale and policy access — then listed metric by metric, so you can see what a single ranking hides.
Largest by GDP, highest disposable income, fastest growing, highest Xiaohongshu and Douyin reach — plus the composite index.
See the tablesOne 0–100 entry score per city: 30% digital access, 30% consumer depth, 25% market scale, 15% policy access. Fully documented, freely citable, downloadable as JSON or CSV.
How the score worksFor premium and international brands, Shanghai and Beijing remain the trend-setting launch pads — Xiaohongshu seeding there cascades nationally. For D2C and e-commerce brands, Hangzhou and Shenzhen offer younger, more digital-native consumers. For cost-efficient coverage, Chengdu and Changsha deliver strong returns with lower media costs.
Tier 1 cities (Shanghai, Beijing, Guangzhou, Shenzhen) have the highest incomes and media costs but the strongest brand-building effect. New Tier 1 cities (Chengdu, Hangzhou, Wuhan, Xi'an…) offer rising consumption, younger populations and materially cheaper customer acquisition — often a better first market for mid-market brands.
GDP, growth and population figures use 2025 official data from the National Bureau of Statistics and provincial/city statistical bulletins. Disposable income reflects the latest available yearbook. Platform penetration rates are estimates based on platform disclosures and industry data — treat them as directional.
Provincial profiles matter for policy, logistics and channel strategy: free-trade zones, cross-border e-commerce pilots and consumption tax rules differ by province. Provincial GDP (e.g. Guangdong $2.05T, Jiangsu $2.00T) also tells you where your distributor and retail partners actually are.
Our China market entry experts can turn this data into a tailored launch strategy for your category.
Data sources & methodology · City rankings · City Entry Index: National Bureau of Statistics and provincial/city statistical bulletins (2025). GDP converted to USD at ≈7.1 CNY/USD. Disposable income reflects the latest available yearbook; platform penetration rates are directional estimates. Verify before investment decisions.