
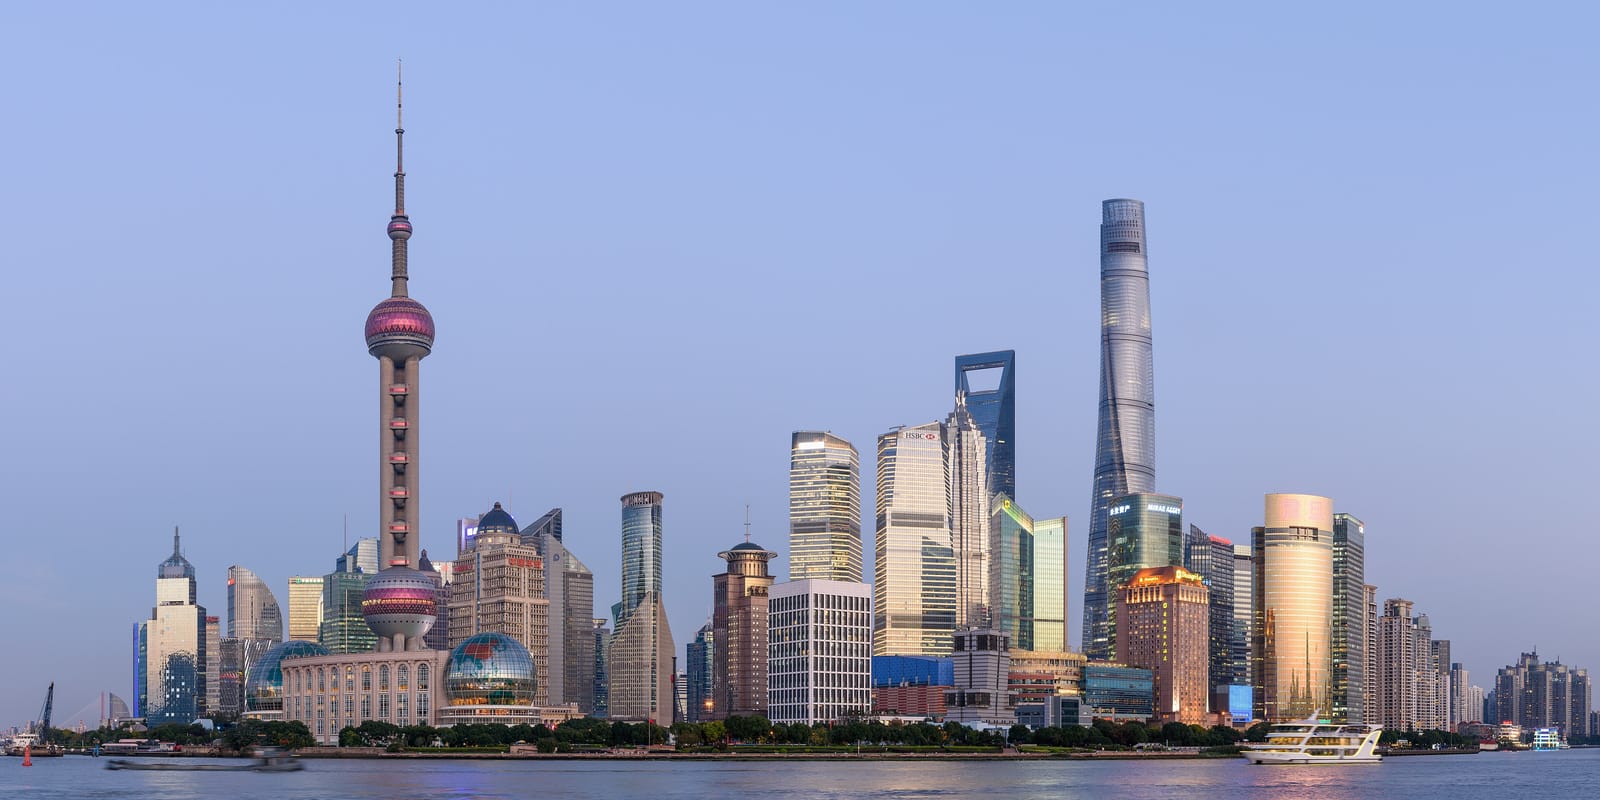
Shanghai 上海
Shanghai ·
Overview
Shanghai (上海) is a Tier 1 city in East China with a permanent population of 24.9M and a 2025 GDP of $760B (5.0% growth). Per-capita disposable income of ¥88.4k places it among China's wealthiest urban markets. Its economy is anchored by finance, luxury retail, automotive and more, and 96.0% of internet users are active on WeChat - making it a international hub for highest disposable income in china.
Shanghai · East China - international transport & logistics hub
Key Indicators (2025)
Digital Platform Penetration (est.)
Estimated % of the city's internet population actively using each platform. Estimates based on platform disclosures and industry data.
Policy Access
85.0 / 100Binary designations from published State Council and ministry notices — a designation either exists or it does not. What it buys you varies by category and by zone management, which this list cannot show. Scoring weights are on the index page.
Entry Index Pillars
YCEI 86.0 · #1Digital, consumer and scale are percentiles within the 51 scored cities in this release; policy is an absolute 0–100 score. Percentiles move when the set changes, so these scores are not comparable across releases.
Shanghai in photos
Cityscapes, culture, nature and daily life — tap any photo to enlarge.
Photos: Wikimedia Commons contributors (CC BY/CC BY-SA/CC0).
Consumption Highlights
Highest disposable income in China. Sets national trends in fashion, beauty, F&B and lifestyle. Strong demand for premium and imported goods.
Key Business Districts
Lujiazui & Nanjing Road (luxury), Xintiandi & Former French Concession (lifestyle), Jing'an Kerry Centre, HKRI Taikoo Hui, West Bund (art & culture).
Brand Entry Tips
Mandatory first market for premium brands. Xiaohongshu seeding here cascades nationwide. Expect the highest media and rental costs in China — budget accordingly.
Frequently asked questions
Is Shanghai the right first market for my brand?
Shanghai is a Tier 1 market with 2025 GDP of $760B and per-capita income of ¥88.4k. Its high spending power justifies premium pricing - Mandatory first market for premium brands. Xiaohongshu seeding here cascades nationwide. Expect the highest media and rental costs in China — budget accordingly.
Which digital platforms matter most in Shanghai?
WeChat reaches an estimated 96.0% of local internet users and is non-negotiable for CRM and private-domain. Douyin covers 78.0% (key for content and livestream e-commerce), while Xiaohongshu reaches 55.0% - a highly engaged community for seeding and reviews.
How should I enter Shanghai?
Start with a province-level view (see the province profile) for policy and logistics context, then run a 3-month pilot: Xiaohongshu/Douyin seeding, a Tmall Global or JD Worldwide store, and a pop-up or distributor trial in Lujiazui & Nanjing Road (luxury). Validate demand before committing to a legal entity.
Compare Shanghai with

Cite this page
YIVA Digital (2025). Shanghai (上海) Market Guide. https://yivadigital.com/tool/china-market-guide/shanghai
Data year 2025. Source: National Bureau of Statistics & provincial statistical bulletins (2025).
Expanding into Shanghai?
Let's build your Shanghai market entry strategy - from platform selection to local KOL partnerships.
Data source: National Bureau of Statistics & provincial statistical bulletins (2025) (2025). GDP converted to USD at ≈7.1 CNY/USD. Figures are indicative - verify before investment decisions. Methodology & limitations