
Head to head · 2025
Nanjing vs Yangzhou
Two hours up the Yangtze: comparable output per head, half the consumer market.
Nanjing leads by 24.5 points. The gap comes mostly from market scale (42.0 points).
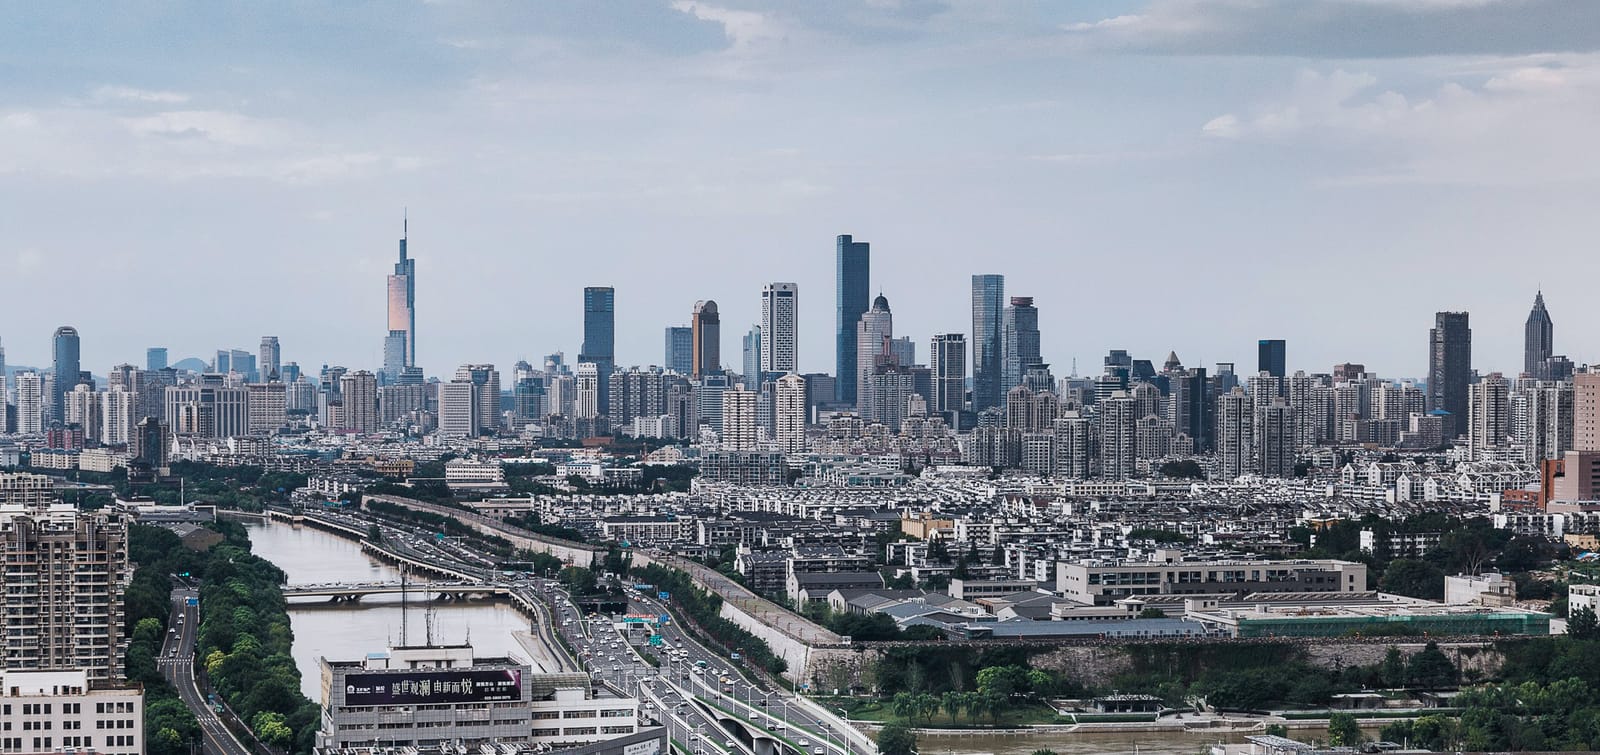
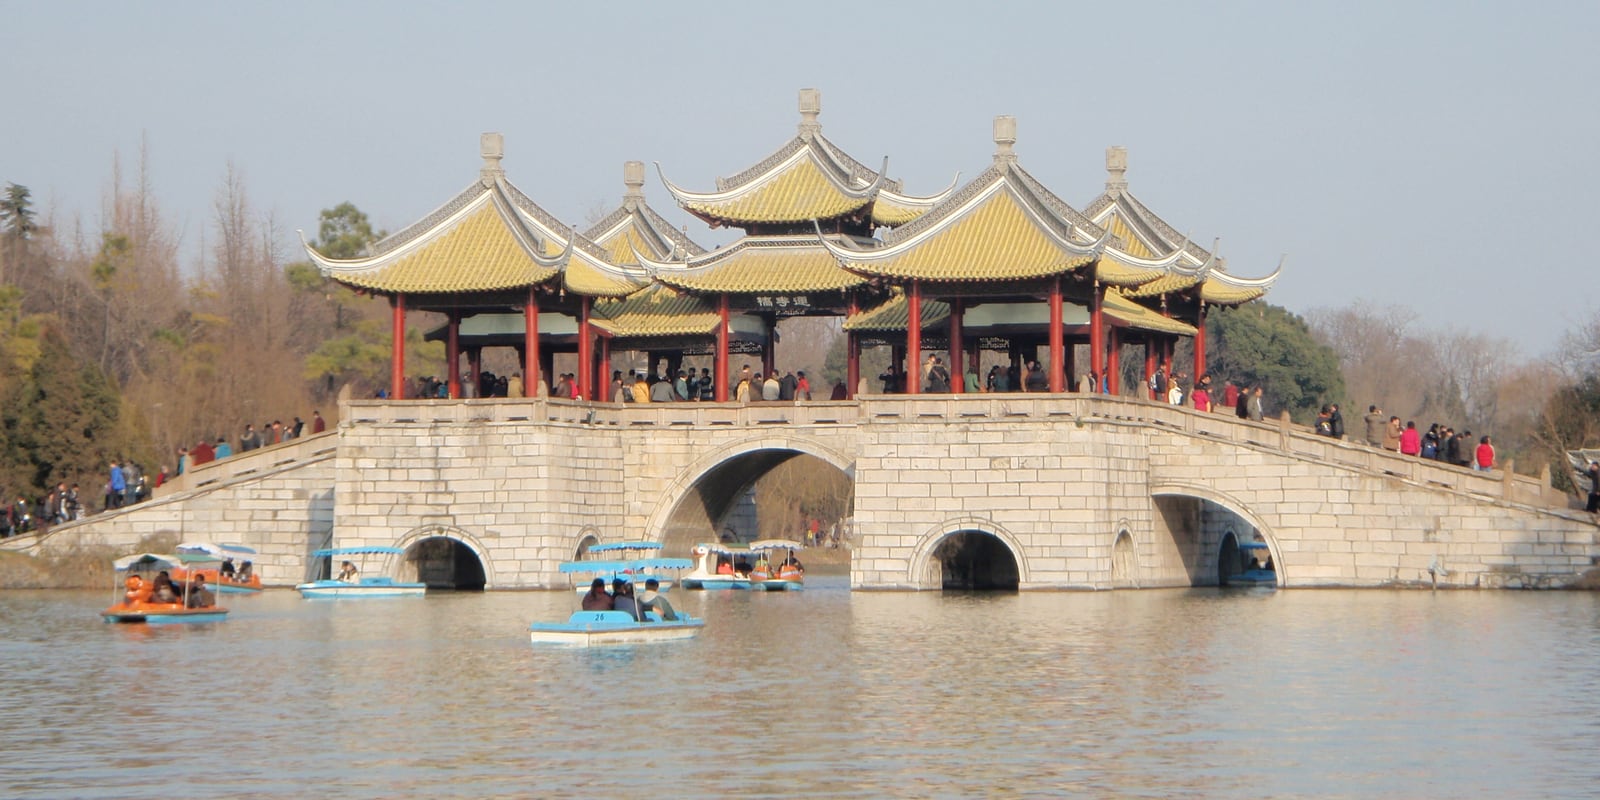
| Metric | Nanjing | Yangzhou |
|---|---|---|
| Entry index0–100, relative to the scored set | 63.8 | 39.3 |
| Rankof 51 scored cities | #12 | #31 |
| Digital reach | 67.9 | 41.3 |
| Consumer depth | 74.8 | 64.8 |
| Market scale | 72.0 | 30.0 |
| Policy access | 20.0 | 0.0 |
| Population | 9.6M | 4.6M |
| GDP | $261B | $110B |
| GDP per resident | ¥193.7k | ¥170.8k |
| Disposable incomeurban residents, per year | ¥69.0k | ¥57.0k |
| Real GDP growth | 5% | 6% |
| WeChat penetration% of internet users | 95% | 93% |
| Douyin penetration% of internet users | 76% | 79% |
| Xiaohongshu penetration% of internet users | 50% | 41% |
Where the scores separate
Largest gaps: market scale (42.0 pts) and digital reach (26.6 pts).
Pillar scores are percentile ranks inside the published set; policy is scored on an absolute 0–100 scale. A gap under three points should not drive a decision. How the index is built.
Nanjing 南京
Jiangsu · T1_5 · east
Key industries
Software & IT · Automotive · Education (top univer… · Finance
Commercial districts
Xinjiekou, Deji Plaza (luxury), Confucius Temple (tourism), Hexi CBD.
Consumption profile
Historic capital with strong university culture (Nanjing University, SEU). High education spending, refined taste for culture and premium brands.
Full Nanjing profile →Yangzhou 扬州
Jiangsu · T3 · east
Key industries
Automotive & parts · Machinery · Petrochemicals · Toys & stationery (Ma…
Commercial districts
Wenchang Pavilion CBD, Slender West Lake (tourism), Maobatan (toys), Yangzhou Economic Development Zone.
Consumption profile
Historic Grand Canal city with a strong F&B and tourism identity (Huaiyang cuisine). Steady upper-middle-class consumption and growing heritage/cultural retail.
Full Yangzhou profile →Questions people ask
- Is Nanjing or Yangzhou the better first city for a brand?
- Nanjing scores 63.8 and Yangzhou scores 39.3 on the YIVA China City Entry Index, out of a 51-city set. Nanjing leads overall. The score compares reach, spending power, size and policy access only — it cannot see competition, media cost or whether your category has demand in either city, so treat it as a shortlist filter rather than a verdict.
- Which is bigger, Nanjing or Yangzhou?
- By gross regional product, Nanjing is larger ($261B against $110B) and has a population of 9.6M versus 4.6M for Yangzhou. Market size is only 25% of the entry index.
- Are these scores comparable with last year's?
- No. Digital reach, consumer depth and market scale are percentile ranks within the published city set, so adding or removing a city moves every score. Compare two cities inside the same release, never across releases.
Other comparisons
Share this result
Nanjing vs Yangzhou: China City Entry Index
Cite this page
YIVA Digital. “Nanjing vs Yangzhou: China City Entry Index comparison.” YIVA Digital, 2025. https://yivadigital.com/tool/china-market-guide/compare/nanjing-vs-yangzhou
Scores are relative to the published city set in this release and are not comparable across releases.