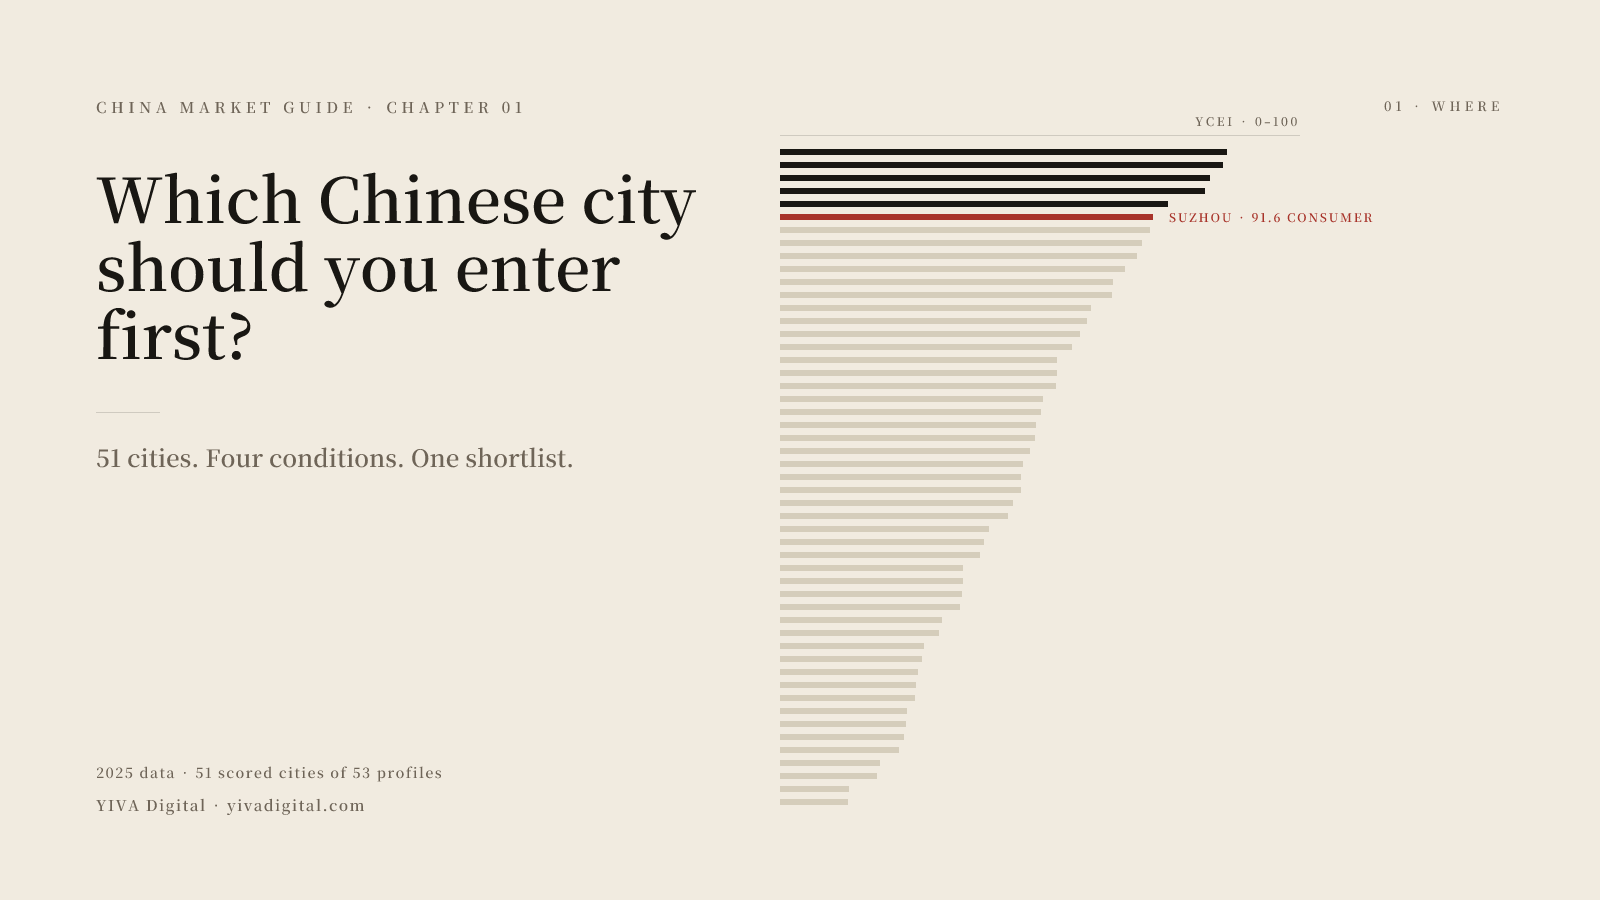
Which Chinese city should you enter first? A four-condition method
Most brands default to Shanghai and find out two quarters later whether that was right. A 0–100 score for 51 Chinese cities, the four conditions behind it, and a three-city method that survives a budget review.
YIVA Digital ·
Which Chinese city should you enter first?
Most foreign brands answer this question the same way: Shanghai, because it is the obvious one, or Beijing, because someone in the company has a contact there. Then they spend two quarters and a budget finding out whether the guess was right.
It is an expensive way to learn geography.
The city you enter first decides more than postcode. It decides which platform matters most, what a media plan costs, whether you can hold stock in bonded warehousing, and how much of your first year goes into logistics rather than demand. Those are not small differences. Across the 51 cities we score, urban disposable income runs from RMB 37,000 in Guilin to RMB 88,366 in Shanghai, and the policy score runs from 0 to 85.
We score 51 Chinese cities on the four conditions that decide whether a first entry survives its first year. This is the method behind that score, and how to use it without treating a number as a recommendation.
The mistake is treating China as one market
A brand that says "we are launching in China" is usually describing a plan that will be executed in one or two cities, priced against one city's media costs, and judged by one city's consumers. The national language hides that.
The practical consequences show up early:
- Channel mix changes by city. Xiaohongshu penetration runs from 58% of internet users in Shenzhen and Hangzhou to 30% in Urumqi. If your entry plan is content-led, that is not a rounding error — it is the difference between a seeding strategy and a paid-media strategy.
- Spending power changes by city. Shanghai's urban disposable income is RMB 88,366 a year. Chongqing's is RMB 45,200. Both are top-ten cities by market scale. A price point that works in one does not automatically work in the other.
- Policy position changes by city. Four cities hold International Consumption Centre designation, 31 host a Free Trade Zone area, 11 are in the services opening-up pilot, and two — Haikou and Sanya — carry offshore duty-free. Which of these you need depends entirely on what you are selling and how you fulfil it.
None of that is visible in a GDP ranking, which is why we do not publish one.
The four conditions
The YIVA China City Entry Index (YCEI) is a 0–100 score built from four pillars, with published weights:
- Digital access — 30%. Xiaohongshu 30%, WeChat 25%, Douyin 25%, internet penetration 20%. Can you reach these consumers on the platforms where they already spend time?
- Consumer depth — 30%. Disposable income 45%, GDP per resident 35%, real GRP growth 20%. Can they afford what you sell, and is that getting better or worse?
- Market scale — 25%. Gross regional product 60%, population 40%. Is the market big enough to carry a fixed cost?
- Policy access — 15%. Four published designations, scored absolutely: International Consumption Centre 35 points, Free Trade Zone member 30, services opening-up pilot 20, offshore duty-free 15.
Three of the four pillars are percentile ranks inside this release. Policy is not ranked at all, because a mostly binary variable has almost no variance — ranking it would turn one missing designation into a twenty-point gap and make a yes-or-no question look like a gradient. It is also capped at 15%, for a reason worth stating plainly: policy changes what you are allowed to do in a market. It does not create the market.
The full weights, bands and limitations are on the methodology page. The ranked table is on the City Entry Index.
Where the four conditions disagree
The composite score is useful for triage. The disagreement between pillars is where the decision actually is — and it is the part a single ranking hides.
Here are four cities from the current release, all in the top 15, that disagree with themselves in instructive ways.
Shenzhen: most reachable, least policy-privileged
Shenzhen scores 90.7 on digital access, the highest in the set, and 88.8 on consumer depth. Its policy score is 30.0, against Guangzhou's 85.0, thirty minutes away by train.
That 55-point policy gap is worth about 8 points of final score — Shenzhen still finishes 4th at 81.7, behind Guangzhou's 82.6. The cap is doing exactly what it was designed to do: a city cannot buy its way up the index with designations, and it cannot be buried by missing them either.
What it means in practice: if your entry is content-led and cross-border, Shenzhen's reach advantage is real and the policy gap is not fatal — you are shipping from a bonded warehouse in another city and selling into Shenzhen's attention. If your entry needs a physical retail footprint or a licensed service, the same gap becomes a workstream.
Suzhou: the richest consumers, and uneven reach
Suzhou has the highest consumer depth in the index, 91.6 — ahead of Shenzhen (88.8), Beijing (87.9) and Shanghai (84.3) — on RMB 74,000 disposable income and 6.0% GRP growth. Its digital access score is 59.9, thirty points below Shenzhen's 90.7. Xiaohongshu reaches 48% of its internet users, against 58% in Shenzhen and Hangzhou.
The city is affluent and comparatively quiet. That combination is either an opportunity or a trap depending on your motion. A premium brand with an offline or marketplace route can treat Suzhou as a high-yield market adjacent to Shanghai. A brand whose entire entry plan is Xiaohongshu seeding will find a thinner content ecosystem than the income figures imply.
The tell: Suzhou ranks 6th overall. Selected on the composite score alone, the tension never appears.
Chongqing: the volume trap
Chongqing is the second-largest market in the index by scale (96.4) and the second-largest by population — 31.9 million residents. Its consumer depth is 40.3, the lowest of any top-ten city.
Scale without depth is the most common way a first entry over-commits. A 31.9-million-person market justifies a big fixed cost on paper; at RMB 45,200 disposable income, the addressable slice of it that can afford a premium price point is far smaller than the headline suggests.
What it means in practice: Chongqing rewards volume models — mass-market FMCG, value retail, logistics-led plays — and punishes premium ones that confuse population with purchasing.
Xiamen: small, wealthy, testable
Xiamen has 5.33 million residents — a sixth of Chongqing — and a consumer depth score of 74.0, ahead of Chengdu and Wuhan. Its scale score is 38.8.
This is what a test market looks like in the data: small enough that a failed experiment is affordable, affluent enough that the result means something, and reachable enough (digital 70.7) that a content-led test produces a readable signal in 90 days.
The three-city method
A composite score answers "which city is best on average". You are not buying an average. You are buying one anchor, one hedge, and one option.
Step 1 — Describe the entry motion before you look at the ranking.
Four motions cover most first entries, and each implies a different pillar weighting:
| Entry motion | What it needs first | Pillar that matters most |
|---|---|---|
| Content-led DTC | Reachable, affluent, platform-dense | Digital access, then consumer depth |
| Marketplace launch (Tmall/JD) | Volume and fulfilment | Scale, then consumer depth |
| B2B pipeline | Industry cluster, talent, travel access | Scale, then policy |
| Physical retail or licensed service | Permission and footfall | Policy, then consumer depth |
If you cannot name your motion in one sentence, the ranking will not help. It will just confirm whichever city you already wanted.
Step 2 — Set a floor per condition, not a composite target.
A city can average 70 and still fail you fatally: a 40 on policy is disqualifying for a licensed service, and a 45 on digital access is disqualifying for a content-led launch, no matter what the other three pillars say.
Write the floors down before you rank anything. A workable starting set for a content-led cross-border entry: digital access ≥ 60, consumer depth ≥ 60, scale ≥ 50, policy ≥ 30. Then check which cities clear all four. It is usually a shorter list than expected — and a different list from the top ten.
Step 3 — Pick one anchor, one test, one option.
- Anchor (about 60% of first-year budget). The city where your motion works on every floor. This is where the team, the stock and the reporting sit.
- Test (about 25%). A city of a different archetype — rich-but-quiet, or small-but-affluent — chosen to answer one specific question ("does this price point hold outside tier-one?"), with a 90-day kill criterion written before launch.
- Option (about 15%). A city you can move into if the test surprises you, kept warm with content and a small always-on budget rather than a launch.
The 60/25/15 split is our default for a first year, not a rule from the data. What matters is that the three cities are structurally different. Three tier-one cities is one bet placed three times.
Step 4 — Re-score annually, and re-read the floors.
Percentile pillars move when the scored set changes. When we added 12 cities in version 1.4, the top 15 kept their order but most mid-table scores rose, because the new cities sat below the median. A shortlist built on last year's numbers is a shortlist built on a different comparison set. Plan the review, not just the launch.
Four ways this goes wrong
- The Shanghai default. Shanghai scores 86.0 and leads the index. It also has the highest costs, the most competition and the deepest talent pool in the country. The index measures access, not opportunity — a market that is easy to enter is usually easy for your competitors too. Shanghai is often right. It should not be right by default.
- The GDP trap. Ranking on gross regional product produces Chongqing above Suzhou and Chengdu above Hangzhou. Scale is 25% of the score for a reason.
- Policy shopping. Brands read "Free Trade Zone member" and assume permission to sell. The designations govern bonded logistics, customs clearance and foreign access in specific service sectors. They do not replace a category licence, and the pillar is capped at 15% because of exactly this confusion.
- The one-city bet. A single city with no test and no option converts a market question into a binary outcome. If it fails, the post-mortem cannot tell you whether the city, the price or the creative was wrong.
What the index cannot tell you
Being explicit about this is part of the method:
- It is not category-aware. A city that is excellent for premium skincare may be mediocre for industrial components. The score describes the market, not the fit.
- Percentiles are relative to this release. 86.0 means "top of these 51 cities", not "86% of attainable".
- Platform penetration is modelled, not measured. It is built from platform disclosures, city internet-user bases and tier classification. Use it to rank cities against each other; use a platform's own reach planner for a media number.
- No media cost, competitor density, talent or distribution data. Those belong in the next layer of the plan.
- Hong Kong and Macao are profiled but not scored. Their social reach runs through WhatsApp, Instagram and Facebook rather than mainland platforms, so mainland penetration is not a comparable measure there.
Do it in ten minutes
- Open the City Entry Index and read the top 15. Note the pillar columns, not just the score.
- Write your four floors, using your entry motion.
- Compare two cities side by side — start with the one you assumed, and the one that scored highest on the pillar you actually need.
- Read the city profiles for your shortlist: key industries, business districts, platform penetration, policy designations.
- Download the dataset if you want to model it yourself — JSON or CSV, CC BY 4.0, via the dataset endpoint.
Ten minutes of this beats two quarters of finding out.
The YIVA China City Entry Index is part of the China-Ready in Five Questions series. Data: 51 scored cities, 53 published profiles, 33 provinces; 2025 statistical bulletin cycle. Cite as YIVA Digital (2025), China Market Guide, yivadigital.com/tool/china-market-guide.
Questions this article answers
Which Chinese city should a foreign brand enter first? There is no single answer, but there is a repeatable method: define your entry motion, set a minimum floor for digital access, consumer depth, market scale and policy access, then shortlist one anchor city, one test city of a different archetype, and one option.
Is Shanghai always the best city to start in China? No. Shanghai leads the YIVA China City Entry Index at 86.0 out of 100, but the index measures access rather than opportunity. Shanghai also carries the highest costs and the most competition, and for some categories a smaller, more affluent city such as Xiamen produces a cleaner first test.
What are the four conditions in the City Entry Index? Digital access (30%), consumer depth (30%), market scale (25%) and policy access (15%). The first three are percentile ranks within the scored city set; policy counts four published designations and is scored absolutely.
Why is policy only 15% of the score? Because policy changes what you are allowed to do in a market, it does not create the market. Ranking a mostly binary variable would also exaggerate small differences, so the pillar is scored absolutely and capped.